



Australian Dollar Forecast: AUD/USD Three-Week Range Nears a Breakout
AUD/USD has spent three weeks trapped beneath resistance, with the next decisive move likely to shape the August outlook.
Share this:

Australian Technical Forecast: AUD/USD Weekly Trade Levels
- AUD/USD has stalled beneath the monthly high after rallying in four of the past five weeks.
- Aussie has traded within a well-defined range below resistance for three consecutive weeks.
- A breakout from the current range to provide important directional guidance into August.
- Event risk on tap into the August open: US ISM services & manufacturing data, ADP employment, and NFPs
- Resistance 7023, 7116/20 (key), 7208/14- Support 6927, 6877/80 (key), ~6825
AUD/USD heads into the July close locked in a well-defined three-week range just beneath major resistance, leaving the pair at a pivotal technical inflection point. Buyers continue to pressure the upper boundary of the range while sellers have been unable to force a meaningful rejection, underscoring the constructive nature of the monthly recovery without yet confirming a breakout. The focus now shifts to whether the weekly and monthly closes can provide the confirmation needed to resolve this consolidation heading into August. Battle lines drawn on the AUD/USD weekly technical chart.
Review my latest Weekly Strategy Webinar for an in-depth breakdown of this Aussie setup and more. Join live on Monday’s at 8:30am EST.
Australian Dollar Price Chart – AUD/USD Weekly
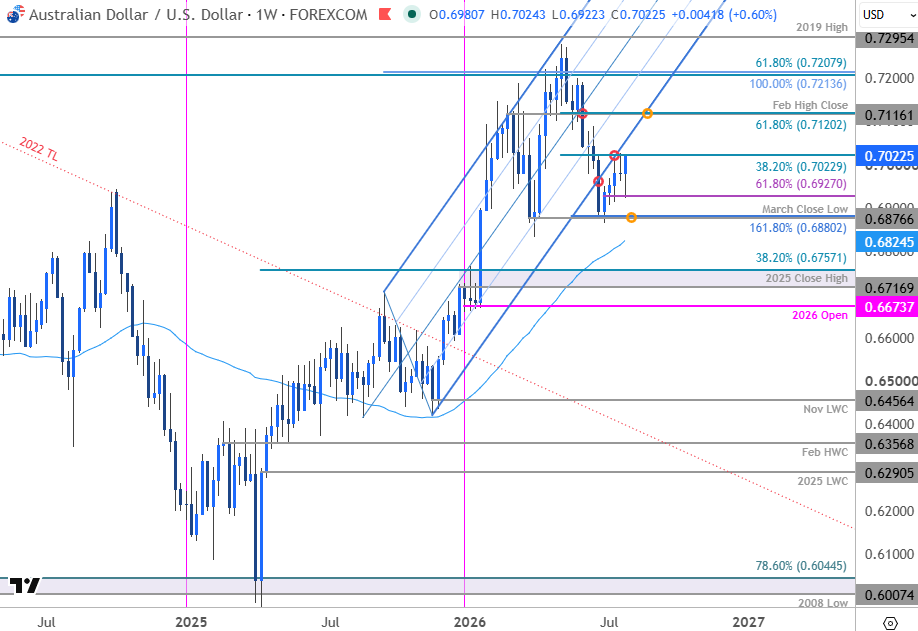
Chart Prepared by Michael Boutros, Sr. Technical Strategist; AUD/USD on TradingView
Technical Outlook: In my last Australian Dollar Forecast we noted that, “AUD/USD has broken the November uptrend with the bears now facing the first major test of technical support. The weekly & monthly opening ranges are taking shape just above and the focus is on a breakout in the days ahead. From a trading standpoint, rallies would need to be limited to 7023 IF price is heading lower on this stretch with a close below 6877 needed to fuel the next major leg of the decline.” Aussie registered an intraday high at 7027 two-weeks later with price stuck in a well-defined range just below resistance for a third week.
Initial support rests with the 61.8% retracement of the late-June advance at 6927 with key support steady at 6877/80- a region define by the March close low and the 1.618% extension of the May decline. A break / weekly close below this threshold would threaten a deeper correction in the weeks ahead with subsequent support seen a the 52-week moving average (currently ~6824) and the 2025 close high / 38.2% retracement of the yearly range at 6717/57.
A topside breach of this key pivot zone would expose key resistance at the February high-close and the 61.8% retracement at 7116/20. Note that former pitchfork support converges on this threshold in mid-August and strength surpassing this slope would suggest a more significant low is place and potential resumption of the broader uptrend. Look for a larger reaction there IF reached. Subsequent resistance objectives are eyed at the 61.8% retracement of the 2021 decline and the 100% extension of the 2025 rally at 7208/14 and the 2019 swing high at 7295.

Bottom line: AUD/USD has rallied four-of-the-past five-weeks (last week marked a weekly doji) with the bulls testing resistance at the monthly high for a third-consecutive week. The immediate focus heading into August is on a breakout of this range for guidance. From a trading standpoint, losses should be limited to 6927 IF price is heading higher on this stretch with a close above 7023 needed to fuel the next leg of the rally.
Keep in mind we get the release of key ISM data next week with the July Non-Farm Payrolls report on tap Friday. Stay nimble into the monthly cross and watch the weekly closes for guidance into the August open. Review my latest Australian Dollar Short-term Outlook for a closer look at the near-term AUD/USD technical trade levels.
Australia / US Economic Calendar
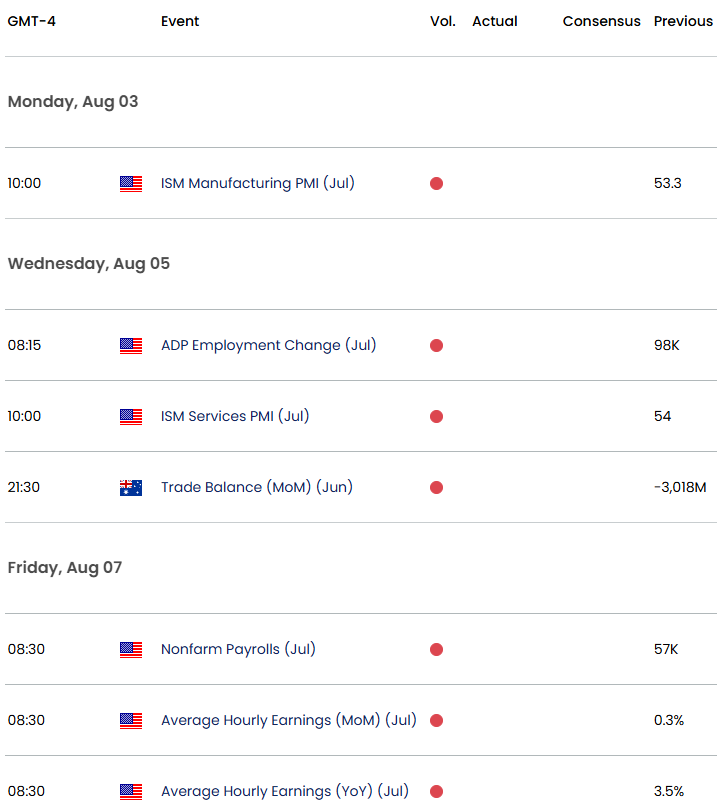
Economic Calendar - latest economic developments and upcoming event risk.
Active Weekly Technical Charts
- Canadian Dollar (USD/CAD)
- S&P 500, Nasdaq, Dow
- Bitcoin (BTC/USD)
- Japanese Yen (USD/JPY)
- Euro (EUR/USD)
- Swiss Franc (USD/CHF)
- Gold (XAU/USD)
- British Pound (GBP/USD)
- US Dollar Index (DXY)
--- Written by Michael Boutros, Senior Technical Strategist
Follow Michael on X @MBForex

The complete CFD trading experience
Award-winning platforms, competitive spreads, low commissions and dedicated support.
We live and breathe the markets and are dedicated to helping traders realise their ambitions as we continue to set the industry bar.
Economic calendar
Web Trader platform
Our sophisticated web-based platform is packed with features.
Related articles

EUR/USD, GBP/USD Price Outlook: Can the Dollar Pullback Fuel a Bullish Rebound?
Could EUR/USD and GBP/USD be confirming a bullish rebound? The DXY’s pullback from the 103 resistance level may support a recovery in both pairs, although confirmation is still needed.


DAX Rebounds, but 25,600 Remains the Level to Hold
The DAX continues to recover from last week's sell-off, supported by easing energy concerns and improving short-term momentum. While buyers have regained control of the four-hour trend, the index is now approaching a critical resistance zone between 25,450 and 25,600. A decisive break higher would strengthen the bullish case and open the door toward 25,800, while failure at resistance could quickly revive downside pressure.


ASX 200 Outlook: A Rates Trade Disguised as a Stock Market?
Australian bond futures have exhibited a far stronger relationship with the ASX 200 than Wall Street over recent months. Now both markets are displaying remarkably similar price structures.

StoneX Europe Ltd may make third party material available on this website which may contain information included but not limited to the conditions of financial markets. The material is for information purposes only and does not contain, and should not be construed as containing, investment advice and/or investment recommendation and/or an investment research and/or an offer of or solicitation for any transactions in financial instruments; any decision to enter into a specific transaction shall be made by the client following an assessment by him/her of their situation.
StoneX Europe Ltd makes no representation or warranty and assumes no liability as to the accuracy or completeness of the information provided, nor any loss arising from any investment based on a recommendation, forecast or other information supplied. You should always seek independent advice as to your suitability to speculate in any related markets and your ability to assume the associated risks, if you are at all unsure. We are not under any obligation to update any such material. Any opinion made may be personal to the author and may not reflect the opinion of StoneX Europe Ltd.