








GBP/JPY bears ride the wave of divergent BOE, BOJ policy expectations
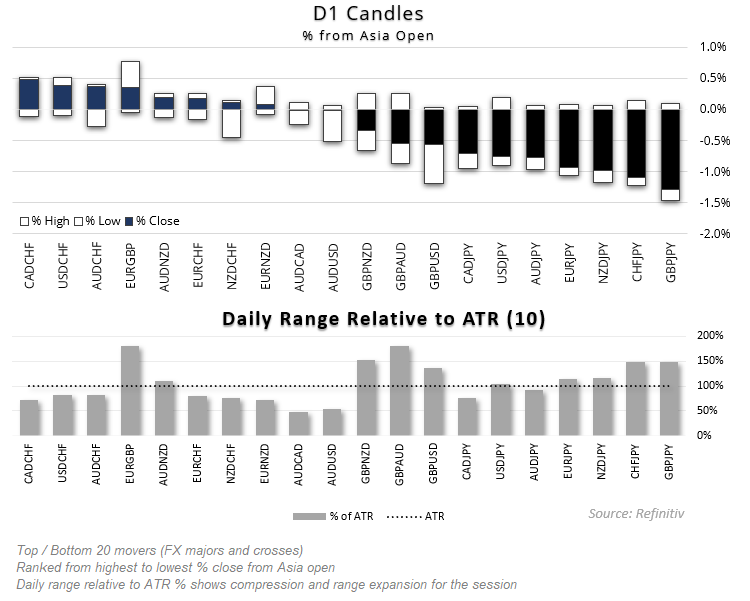
A dovish BOE cut and bets that a BOJ hike could be much closer than expected saw GBP/JPY lead the way lower on Thursday. But price action across the board suggests it could be year of the yen.
Share this:

The Japanese yen was the strongest FX major on Thursday on hawkish BOJ bets, after NPJ member Tamura urged the central bank to raise rate to at least 1%. With rates currently at 0.5%, this plays with market pricing of two more cuts this year. Inflationary risks are building with companies set to raise wages further, and bets are on for the next hike to arrive as early as April.
The yen was broadly lower, sending USD/JPY below 152 and seeing it on track for its most bearish week in ten. And if NFP is to surprise to the downside, it could even test 150 ahead of the weekend if its current trajectory is to be maintained.
GBP/USD was the weakest major after a dovish 25bp cut from the BOE, taking rates to 4.5% from 4.75%. It was a unanimous decision with a 9-0 vote in favour of a cut, though some policy makers wanted more. Most notably, Catherine Mann – an MPC member recently opposed to cuts – voted for a 50bp cut alongside Swati Dhingra. So while BOE governor Bailey said he expects further easing and the bank will continue to make decisions “meeting by meeting”, pressure is clearly building for action to come sooner than later.
The divergent theme between the BOJ and BOE saw GBP/JPY lead the way lower on Thursday, dropping below 189 and hitting its lowest point since December. And there could be further for the cross to fall looking at price action clues on the weekly timeframe.
GBP/JPY technical analysis:
GBP/JPY fell hard during its five-week decline from the July high, followed by a 3-wave retracement towards 200. Bearish momentum has now realigned with that initial selloff and two lower highs have formed below 200. Now trading at the week’s lows and just pips above the December high, a break beneath it seems far more likely than not.
The September low around 184 low and August low around 180 make likely targets over the coming weeks for the cross, but if we see an all-out strengthening of the yen this year as I anticipate, 172 at a minimum seems feasible as it lands around a 100% projection, 200-week SMA and October 2022 high. But assuming we are in a 5-wave move lower, 160 sits jus beneath the 138.2% projection.
The daily chart shows prices holding above the December low and monthly S1 pivot and the RSI (2) is oversold. If GBP/JPY is kind enough to treat us to a bounce, it may be on the shallow side, and I suspect bears are simply waiting to reload for a bearish breakout towards the September low.
See my longer-term views on AUD/JPY and EUR/JPY
See my longer-term views on AUD/JPY and EUR/JPY
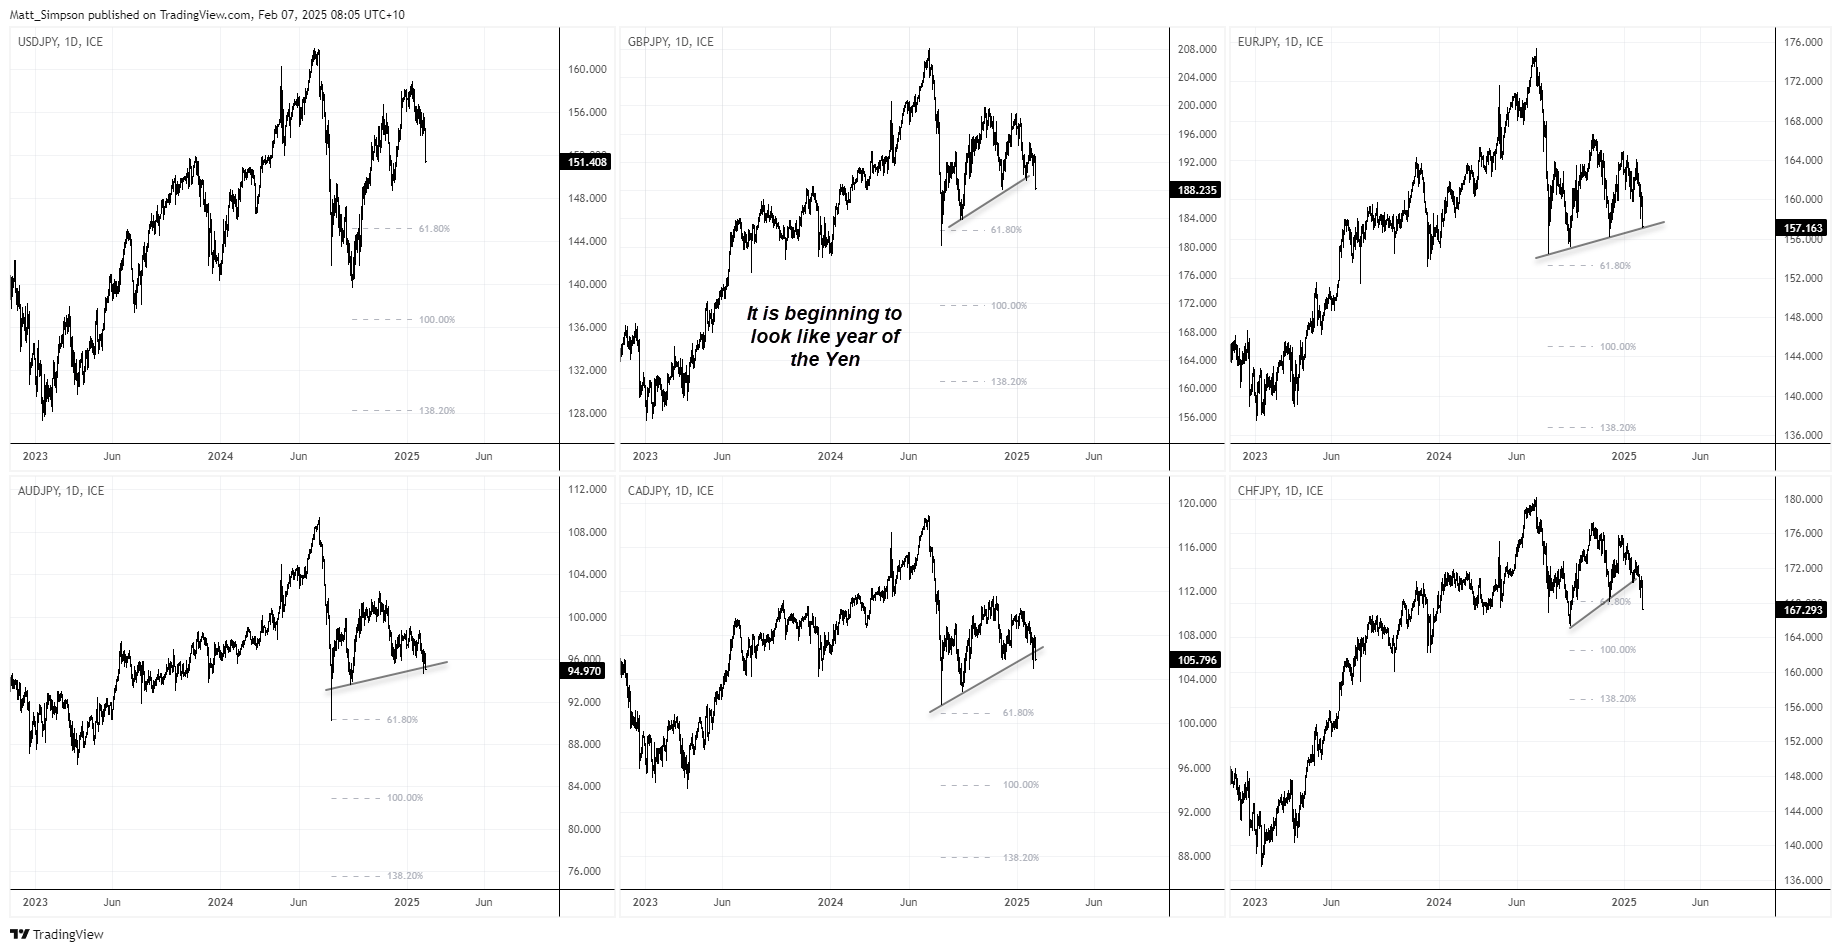
But what can be seen on GBP/JPY can also be applied across most yen pairs. If we take a step back to admire the view, it shows the yen is strengthening across the board, and this certainly plays into my bias of a much lower AUD/JPY and ERUR/JPY this year, alongside GBP/JPY.
To see CHF/JPY also falling shows that the yen is the weapon of choice for safe haven flows, alongside the fact that the SNB (Swiss National Bank) mentioned negative rates recently.
The lower high on AUD/JPY keeps a head and shoulders top alive, and the cross could trade as low as 76 should bears gun for the 138.2% Fibonacci ratio. CAD/JPY already appears to have breached the neckline of its own H&S top, which can bed a continuation pattern during a downtrend. I wouldn’t really call GBP/JPY a head and shoulders, but it is now beneath trend support and bearish momentum is clearly increasing after a series of lower highs. Price action on USD/JPY is the least bearish as its uptrend on the weekly chart remains intact, but even here is succumbing to yen strength. And so soon into the Chinese new year, it is beginning to look like year of the yen.
Economic events in focus (AEDT)
- 10:30 – JP household spending
- 10:50 – JP foreign reserves (USD)
- 16:00 – JP coincident, leading indicators
- 18:00 – DE industrial production
- 23:15 – BoE MPC member Pill speaks
- 00:30 – US nonfarm payrolls report
- 00:30 – CA employment report
- 02:00 – US consumer sentiment (Michigan University)
- 04:00 – FOMC Kugler speaks
- 05:00 – US GDPnow
View the full economic calendar
View the full economic calendar
-- Written by Matt Simpson
Follow Matt on Twitter @cLeverEdge
How to trade with City Index
You can trade with City Index by following these four easy steps:
- Open an account, or log in if you’re already a customer
• Open an account in the UK
• Open an account in Australia
• Open an account in Singapore
- Search for the market you want to trade in our award-winning platform
- Choose your position and size, and your stop and limit levels
- Place the trade
Related tags:


The complete CFD trading experience
Award-winning platforms, competitive spreads, low commissions and dedicated support.
We live and breathe the markets and are dedicated to helping traders realise their ambitions as we continue to set the industry bar.
Economic calendar
Web Trader platform
Our sophisticated web-based platform is packed with features.
Related articles
USD/CAD shooting star puts September surge on notice
USD/CAD has printed a clear bearish reversal pattern after an extraordinary September surge, but confirmation may depend heavily on how US Treasury yields react to Friday’s payrolls report.

USD/MXN Analysis: Is Super Peso Starting to Fade?
Over recent trading sessions, the Mexican peso has continued to show signs of weakness against the U.S. dollar. This can already be seen in USD/MXN, which has gained more than 1.7% over the last three sessions, highlighting sustained buying pressure in favor of the dollar in the short term.


Canadian Dollar Analysis: USD/CAD Returns to July Highs Ahead of NFP
The Canadian dollar continues to face one of its most challenging environments in recent months when it comes to maintaining strength against the U.S. dollar. The weakness of the Canadian currency is clearly reflected in USD/CAD, which has now recorded nine consecutive bullish sessions and gained more than 1.7% during that period.
StoneX Europe Ltd may make third party material available on this website which may contain information included but not limited to the conditions of financial markets. The material is for information purposes only and does not contain, and should not be construed as containing, investment advice and/or investment recommendation and/or an investment research and/or an offer of or solicitation for any transactions in financial instruments; any decision to enter into a specific transaction shall be made by the client following an assessment by him/her of their situation.
StoneX Europe Ltd makes no representation or warranty and assumes no liability as to the accuracy or completeness of the information provided, nor any loss arising from any investment based on a recommendation, forecast or other information supplied. You should always seek independent advice as to your suitability to speculate in any related markets and your ability to assume the associated risks, if you are at all unsure. We are not under any obligation to update any such material. Any opinion made may be personal to the author and may not reflect the opinion of StoneX Europe Ltd.