






GBPUSD in 400 Pip Range
GBP/USD is in a 400-pip range today and up 2.5%
Share this:

GBP/USD is in a 400-pip range today and up 2.5% as the Bank of England held their scheduled monetary policy meeting earlier today and left rates unchanged at 0.1%, as expected. This meeting comes only days after the BOE had two emergency rate cuts and slashed rates to its lowest rate ever. The BOE in recent days also began a 200 billion Pound Quantitative Easing program and said they are ready to do more if necessary. The Great British Pound continued its bid on the European open from yesterday’s intraday low of near 1.1650. In addition, the US Dollar has been getting pummeled all day, down 1.5%, pushing the GBP higher vs the US Dollar.
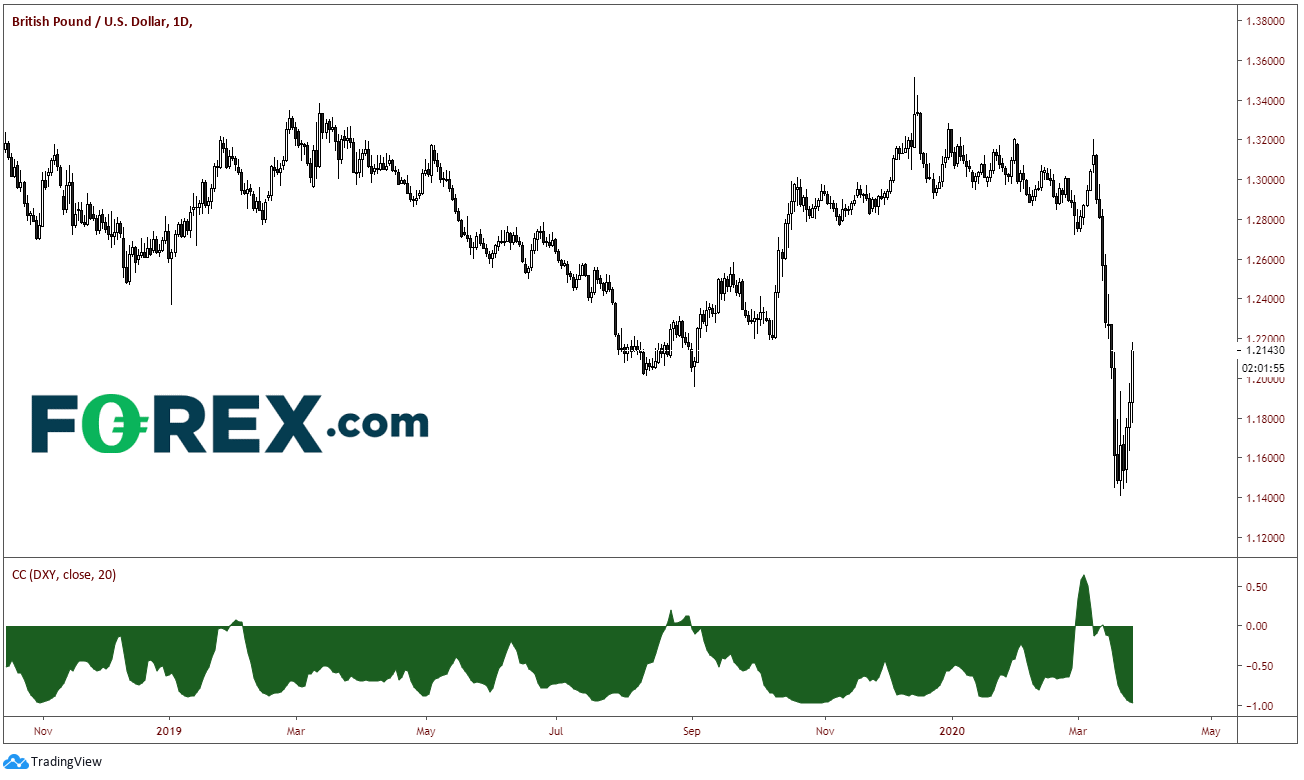
On March 9th, GBP/USD put in a high of 1.3200 and began trading lower as it seemed Boris Johnson was not yet 100% ready to deal with the coronavirus pandemic. Also, at that time, the US Dollar became a flight to safety as stock markets around the world began to selloff and move towards bear market territory. On March 20th, the pair out in a low of 1.1410 as the BOE cut rates to 0.1% and the DXY was topping. On the chart below, the bottom portion shows the correlation between the GBP and the DXY. Before GBP/USD peaked on February 20th, the pair broke its normal behavior and the correlation was positive. Once price peaked, the correlation coefficient stated moving lower and is currently at -0.97, meaning that the GBP and the USD move are currently moving in opposite directions 97% of the time!
Source: Tradingview, City Index
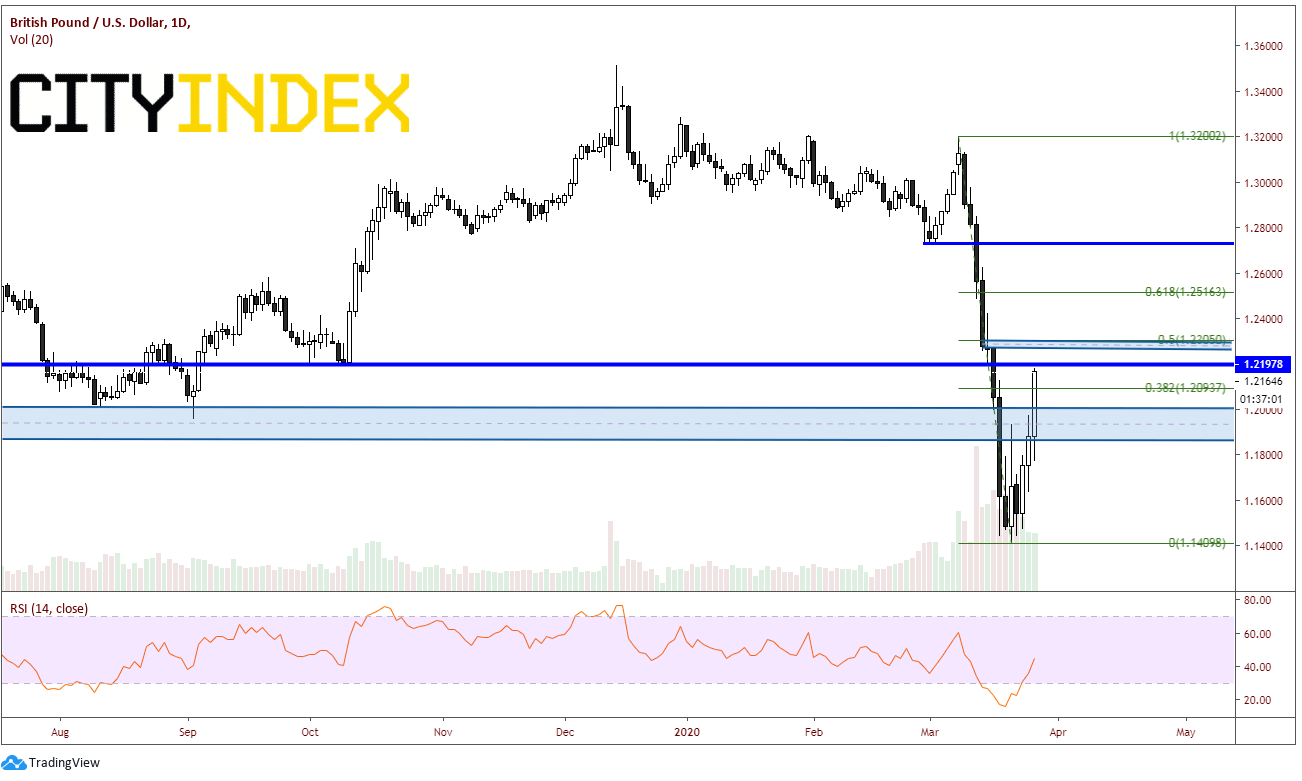
Today’s move in GBP/USD was monstrous. Price broke higher through a large resistance band between 1.1860 and 1.2000. In addition, the pair broke through the 38.2% Fibonacci retracement level from the highs on February 20th to the lows on March 9th near 1.2093. There is strong horizontal resistance just above today’s highs near 1.2200. Above there is a small band of intraday resistance and the 50% retracement level from the same time period between 1.2275 and 1.2305. The next resistance level is nearly 200 pips higher at the 61.8% Fibonacci retracement level near 1.2516.
Source: Tradingview, City Index
As for support, there really isn’t much until the psychological round number at 1.2000. Below that is the previous band of resistance between down to 1.1860. There is also horizontal support near 1.1640. The final support level is the low from March 20th at 1.1410.
Source: Tradingview, City Index
If traders dare to enter a GBP/USD position, be ready for volatility and some massive moves. Make sure to watch for sudden changes in the DXY as well, as these two currencies are almost perfectly negatively correlated. A change in the direction of the DXY could mean a change in direction for the GBP/USD!
GBP/USD is in a 400-pip range today and up 2.5% as the Bank of England held their scheduled monetary policy meeting earlier today and left rates unchanged at 0.1%, as expected. This meeting comes only days after the BOE had two emergency rate cuts and slashed rates to its lowest rate ever. The BOE in recent days also began a 200 billion Pound Quantitative Easing program and said they are ready to do more if necessary. The Great British Pound continued its bid on the European open from yesterday’s intraday low of near 1.1650. In addition, the US Dollar has been getting pummeled all day, down 1.5%, pushing the GBP higher vs the US Dollar.
On March 9th, GBP/USD put in a high of 1.3200 and began trading lower as it seemed Boris Johnson was not yet 100% ready to deal with the coronavirus pandemic. Also, at that time, the US Dollar became a flight to safety as stock markets around the world began to selloff and move towards bear market territory. On March 20th, the pair out in a low of 1.1410 as the BOE cut rates to 0.1% and the DXY was topping. On the chart below, the bottom portion shows the correlation between the GBP and the DXY. Before GBP/USD peaked on February 20th, the pair broke its normal behavior and the correlation was positive. Once price peaked, the correlation coefficient stated moving lower and is currently at -0.97, meaning that the GBP and the USD move are currently moving in opposite directions 97% of the time!
Source: Tradingview, FOREX.com
Today’s move in GBP/USD was monstrous. Price broke higher through a large resistance band between 1.1860 and 1.2000. In addition, the pair broke through the 38.2% Fibonacci retracement level from the highs on February 20th to the lows on March 9th near 1.2093. There is strong horizontal resistance just above today’s highs near 1.2200. Above there is a small band of intraday resistance and the 50% retracement level from the same time period between 1.2275 and 1.2305. The next resistance level is nearly 200 pips higher at the 61.8% Fibonacci retracement level near 1.2516.
Source: Tradingview, FOREX.com
As for support, there really isn’t much until the psychological round number at 1.2000. Below that is the previous band of resistance between down to 1.1860. There is also horizontal support near 1.1640. The final support level is the low from March 20th at 1.1410.
Source: Tradingview, FOREX.com
If traders dare to enter a GBP/USD position, be ready for volatility and some massive moves. Make sure to watch for sudden changes in the DXY as well, as these two currencies are almost perfectly negatively correlated. A change in the direction of the DXY could mean a change in direction for the GBP/USD!



The complete CFD trading experience
Award-winning platforms, competitive spreads, low commissions and dedicated support.
We live and breathe the markets and are dedicated to helping traders realise their ambitions as we continue to set the industry bar.
Economic calendar
Web Trader platform
Our sophisticated web-based platform is packed with features.
Related articles

AUD/USD Bulls Fight Back After Australian Jobs Shock
AUD/USD has been hit by another ugly Australian employment report, sending RBA rate hike expectations sharply lower. Yet the relationships driving the currency have shifted since quarter-end, and improving risk appetite could provide the fuel for a recovery.

USD/JPY Update: Can the Japanese Yen Sustain Its Recovery?
Short-term price action around the Japanese yen has started to show some relative improvement over recent sessions. This can be seen in the recent performance of USD/JPY, which has now recorded three consecutive daily declines in favor of the Japanese currency, resulting in a depreciation of roughly 0.35% over the period.


US Dollar Technical Outlook: DXY, Treasury Yields Retreat Despite Hot CPI 10 15 2026
The US Dollar is testing major support despite hotter inflation as Fed pushback cools yields and forces markets to reassess the path for tightening.

StoneX Europe Ltd may make third party material available on this website which may contain information included but not limited to the conditions of financial markets. The material is for information purposes only and does not contain, and should not be construed as containing, investment advice and/or investment recommendation and/or an investment research and/or an offer of or solicitation for any transactions in financial instruments; any decision to enter into a specific transaction shall be made by the client following an assessment by him/her of their situation.
StoneX Europe Ltd makes no representation or warranty and assumes no liability as to the accuracy or completeness of the information provided, nor any loss arising from any investment based on a recommendation, forecast or other information supplied. You should always seek independent advice as to your suitability to speculate in any related markets and your ability to assume the associated risks, if you are at all unsure. We are not under any obligation to update any such material. Any opinion made may be personal to the author and may not reflect the opinion of StoneX Europe Ltd.