



Gold Works to Complete Strongest Month in 18 Years, $4600 in-Play
Gold extended its breakout last week on the US Treasury buyback announcement and since, pullbacks have remained extremely shallow with another illustration this morning as buyers bid a quick test of the $4600 level.
Share this:

Gold Talking Points:
- The fundamental backdrop favors gold as the US Treasury Secretary has continued to talk up ways of keeping yields low without mentioning the prospect of cutting spending or raising taxes.
- Fundamentals aren’t a perfect push point for price as only actual buying and selling drives market movements, and the question now is whether the long side is top heavy on a short-term basis with daily RSI showing overbought readings.
- This doesn’t necessarily spell reversal but it could highlight possible pullbacks, which could be monitored for bullish trend continuation purposes.

Gold prices are currently up close to 14% in the month of August and that’s the strongest month for spot XAU/USD in at least 17 years, with a bit of time left to go. And more attractive than just the rally is how the move happened, with six months of digestion from the prior parabolic rally followed by a build of support at the $4k level.
This illustrates the possibility of central bank reserves pushing into gold and away from other markets. China, for example, holds more than half a trillion less in US Treasuries than they did in 2015, when Donald Trump began talking up trade wars ahead of his first term in office. And this isn’t resultant of a Chinese economy contracting as much as diversifying away reserves into other markets, such as gold.
So when we saw repeated tests and failure from sellers to push through a downside break at $4k the first thing that comes to mind is a big market player (or several of them) jumping in to buy at a ‘perceived value.’
Gold Weekly Chart: $4k Defense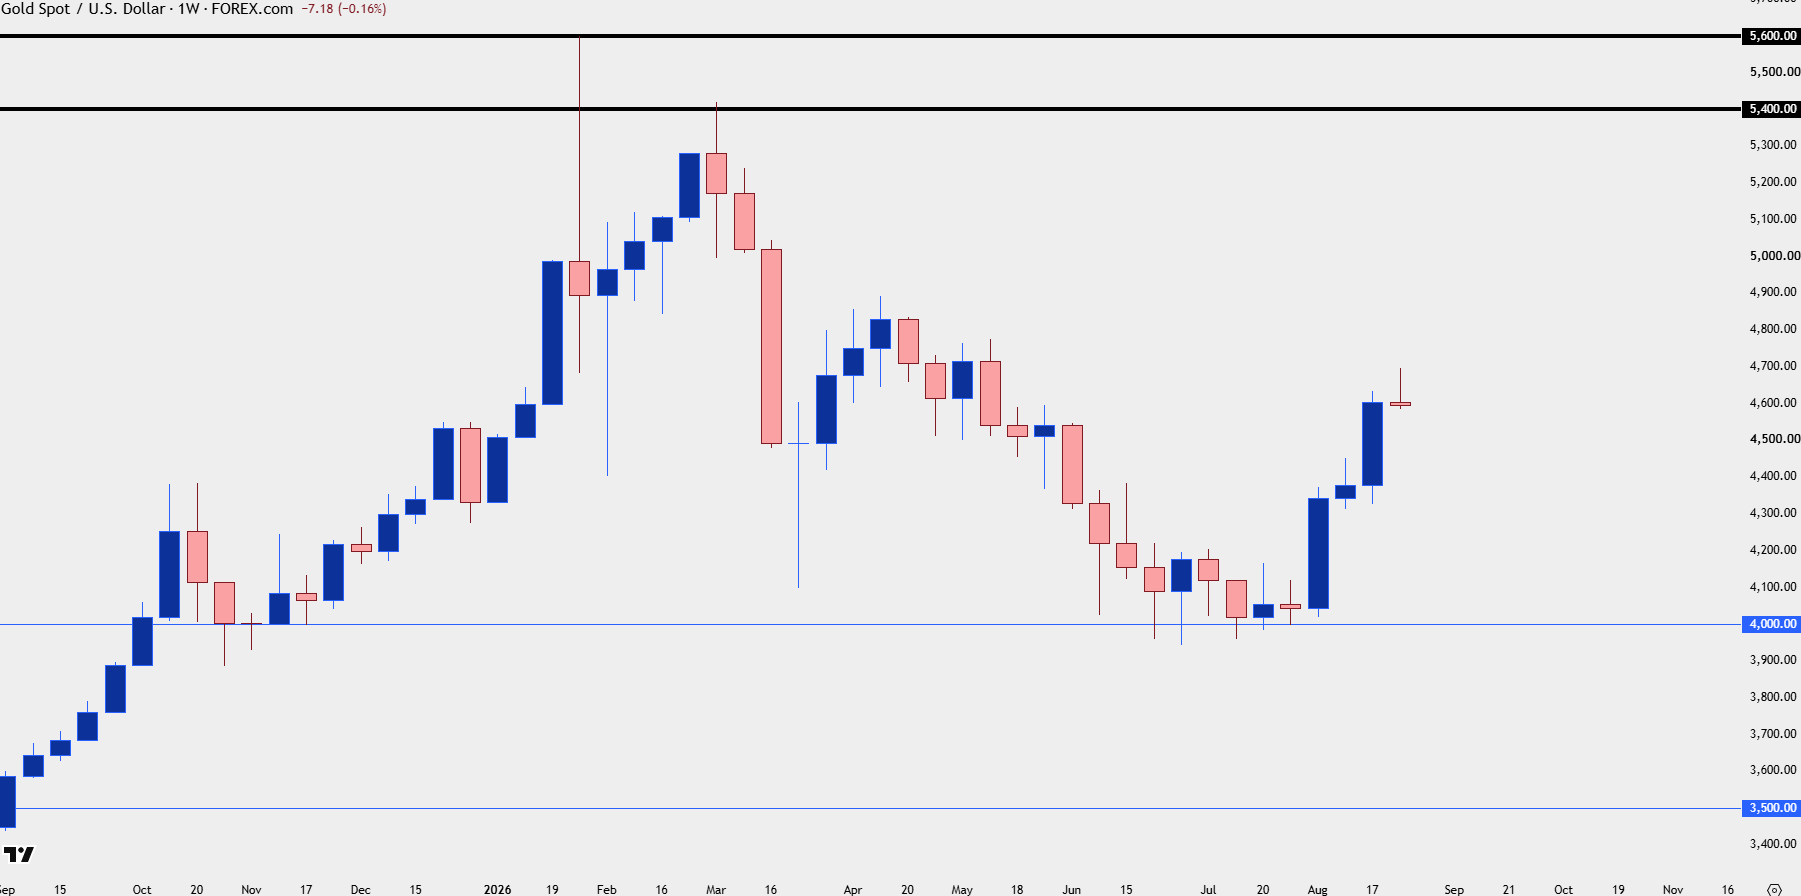
Chart prepared by James Stanley; data derived from Tradingview
This wouldn’t necessarily spell a direct bullish reversal, however, as this would merely set a floor of sorts that would grind through sellers looking to pare positions. What would be needed to fire that reversal is a return of demand at fresh short-term highs, and then a show from buyers on initial pullbacks to establish higher-lows and that’s what’s arrived in the month of August.
In late-July, as Kevin Warsh and the Fed avoided rate hikes despite a coin flip probability of getting one, followed by a dual intervention in the Japanese Yen, the fundamental backdrop was warming for such a scenario and I even tweeted this at the time.
Gold: The Fundamental Backdrop Leading into August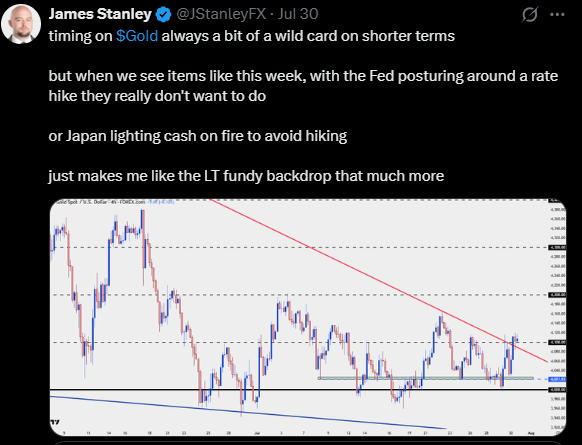
Taken from @JStanleyFX on X.com
Gold Techs
As alluded to in the message above shorter-term dynamics will often derive influence from quirks related to small sample sizing, longer-term looks at a market can help to highlight the underpinnings of what may drive that next move, and this is what I had highlighted as we came into August with gold setting up multiple support tests at the $4k handle.
As that support was in play, gold built a falling wedge which is a formation often approached with aim of bullish reversal, and that broke out in a big way the week after the FOMC rate decision, with another shot-in-the-arm at the US Treasury buyback announcement.
Gold Daily Chart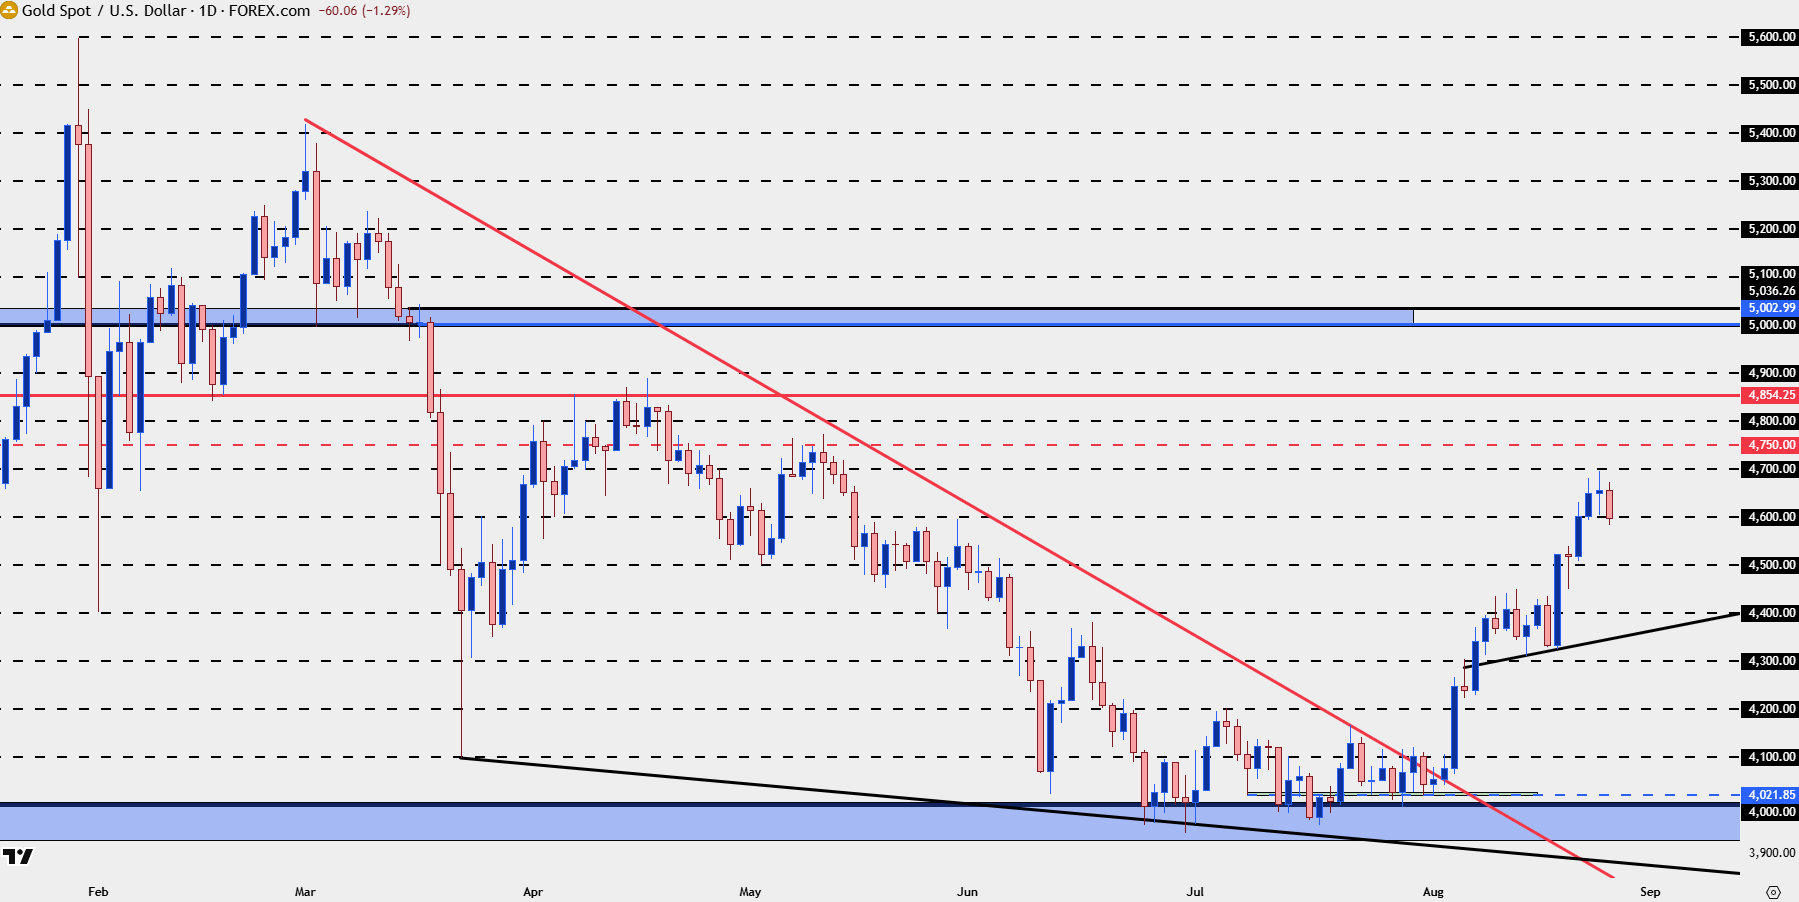
Chart prepared by James Stanley; data derived from Tradingview
Gold Strategy
At this point the trend is bullish on longer-term charts and the challenge remains one of dealing with an overbought market, with daily RSI currently showing a push back-below the 70 level (although that can change based on today’s daily close).
That’s normally construed as a bearish indication although RSI is notoriously ‘untimely’ when dealing with prolonged trend situations, particularly when there’s a new trend taking over that can push the indicator into overbought or oversold conditions for weeks or months at a time. This is what happened in September and October of last year, then again in December, and then in January of this year, so I wouldn’t want to read too much into that dynamic although it can be helpful in highlighting the danger of chasing.
Instead, a pullback can open the door for bullish continuation scenarios and we already have the nearest spot of interest for that in-play right now with $4600. A bit deeper, a prior zone of resistance from the $4524 level down to the psychological level of $4500 stands out, and that’s followed by the prior swings at $4435-$4450.
With such scenarios you can’t expect perfection nor can you expect to call the ‘exact’ bottom, and this is where something like candlestick formations can come into play even on a shorter-term chart, such as the four-hour. A hammer formation or perhaps even a doji after a pullback, which could allude to a possible short-term morning star formation could be seen as bullish catalysts in the direction of the larger trend.
Gold Four-Hour Price Chart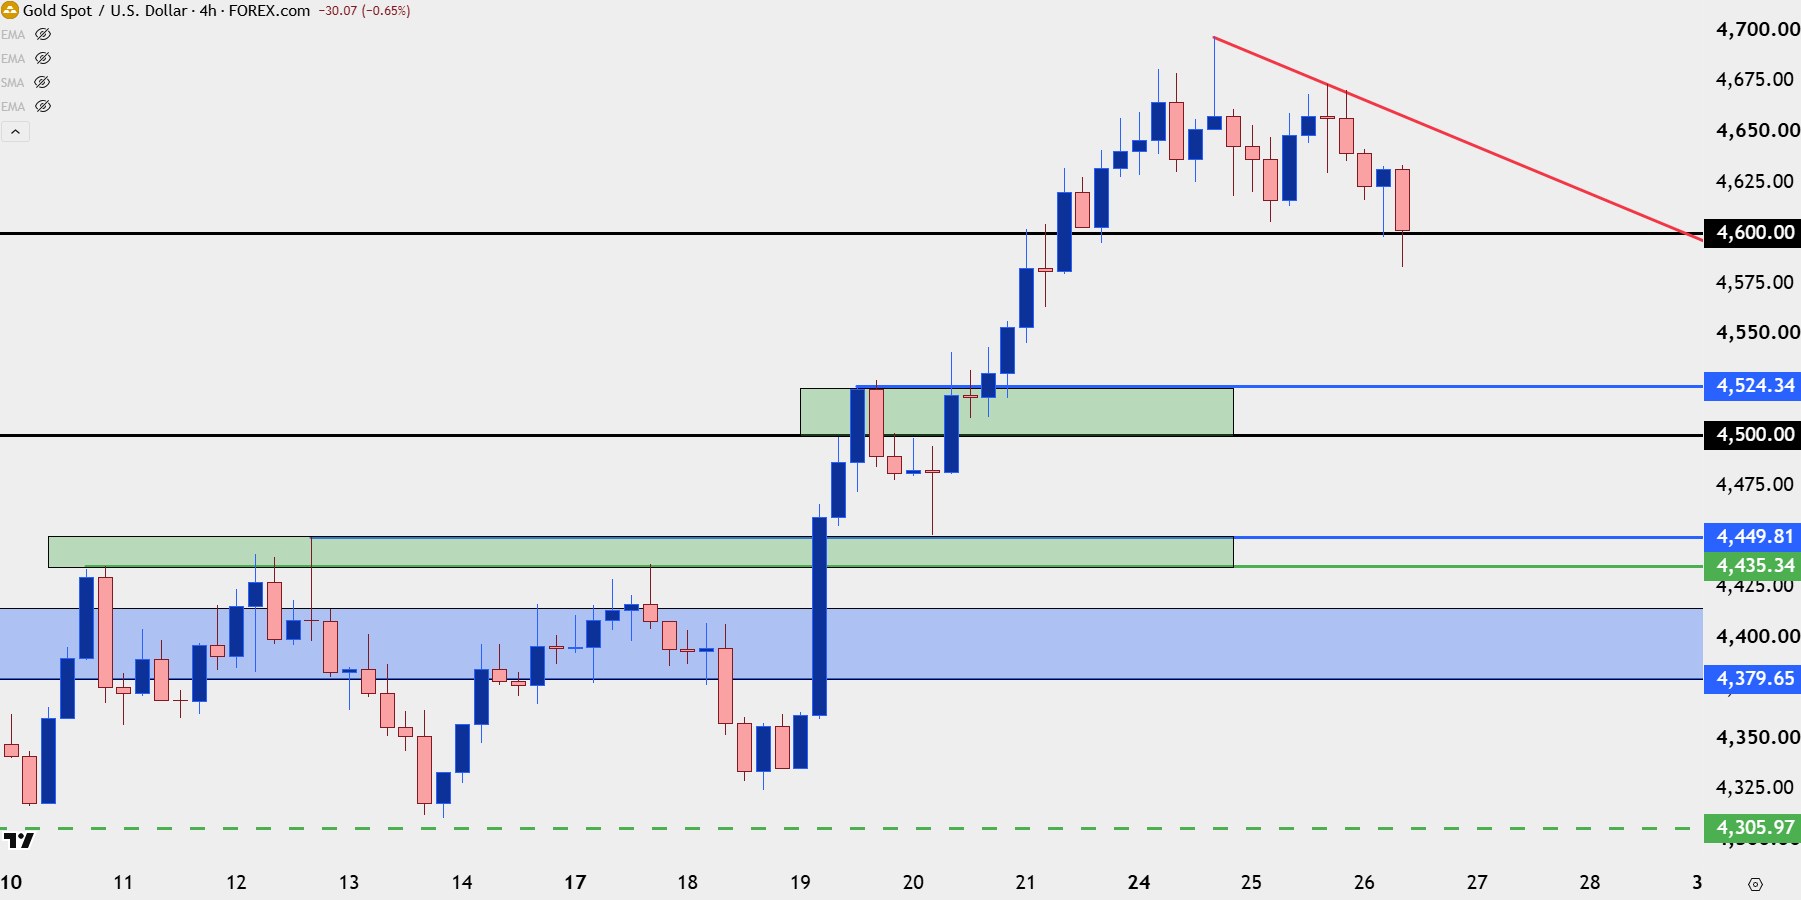
Chart prepared by James Stanley; data derived from Tradingview
--- written by James Stanley, Senior Market Analyst, Global Macro
Related tags:
Latest market news




The complete CFD trading experience
Award-winning platforms, competitive spreads, low commissions and dedicated support.
We live and breathe the markets and are dedicated to helping traders realise their ambitions as we continue to set the industry bar.
Economic calendar
Web Trader platform
Our sophisticated web-based platform is packed with features.
Related articles
Gold Price Outlook: XAU/USD Resistance at $4200 Sets Up for NFP
It was a strong sell-off to start the week in gold and despite a Tuesday bounce, sellers are continuing to push following a resistance hit at the $4200 level.

Nasdaq Breakout Potential into Q4 for Melt Up Scenarios
The headlines seem negative in almost any place that you look, with surging Treasury yields and frothy AI valuations getting more and more attention. But, if it’s so bad, why hasn’t the Nasdaq melted down yet, even as the Fed has started hiking rates?

Japanese Yen Technical Analysis: USD/JPY Support Test into Core PCE
USD/JPY has been a battlefield for the past two months as the force of intervention and the threat of more have given sellers an advantage, even as buyers have continued to bid support on pullbacks. This sets the stage for a massive finish to the week with Core PCE and Non-farm Payrolls.
StoneX Europe Ltd may make third party material available on this website which may contain information included but not limited to the conditions of financial markets. The material is for information purposes only and does not contain, and should not be construed as containing, investment advice and/or investment recommendation and/or an investment research and/or an offer of or solicitation for any transactions in financial instruments; any decision to enter into a specific transaction shall be made by the client following an assessment by him/her of their situation.
StoneX Europe Ltd makes no representation or warranty and assumes no liability as to the accuracy or completeness of the information provided, nor any loss arising from any investment based on a recommendation, forecast or other information supplied. You should always seek independent advice as to your suitability to speculate in any related markets and your ability to assume the associated risks, if you are at all unsure. We are not under any obligation to update any such material. Any opinion made may be personal to the author and may not reflect the opinion of StoneX Europe Ltd.