




Japanese Yen Technical Analysis: USD/JPY, EUR/JPY, GBP/JPY
USD/JPY has been very range bound since the early-August pullback but given the fresh lows in DXY, that says quite a bit about Yen-weakness. EUR/JPY and GBP/JPY are both trading around recent highs and retain breakout potential.
Share this:

Japanese Yen Talking Points:
- USD/JPY rallied to start the week but has since recoiled back towards support. The pair has been very range bound for more than a month now.
- EUR/JPY has re-tested the prior high and GBP/JPY is vying for a breakout from the 200.00 psychological level at the time of video and article production.
- I’ll be looking into all three markets during tomorrow’s webinar and you’re welcome to join. Click here to register.
The US Dollar has been weak since the NFP release in early-August, which was on the heels of the currency’s strongest monthly outing in more than three years. But, in USD/JPY, that weakness hasn’t been very noticeable over the past month and change as the pair has continued to meander in a fairly well-defined range.
Last week saw buyers try to push a breakout although they failed at the 200-day moving average, and this week started with another push up to resistance only to see sellers swat the pair back down towards support.
As we move into an important CPI print later in the week, there could be a justifiable case for a bullish bias, given that short-term high last week along with a recent hold of higher-lows. But the deduction of Yen-weakness against a USD that’s been weak in many other FX markets highlights the fact that there may be more attractive venues to work with a falling JPY.
For range traders, however, USD/JPY can remain of interest, as there’s been multiple holds of support in the 146.94-147.14 zone, to go along with resistance at 147.94-148.13, followed by 148.51 and then another zone from 149.23-149.39.
USD/JPY Daily Chart
Chart prepared by James Stanley; data derived from Tradingview
EUR/JPY
There’s some history with EUR/JPY and the 170.00 level and that story saw the plot thicken in the July-August tangle at the level.
The pair came close to that price back in 2007 and 2008 without being able to test above, ultimately falling just 4.1 pips shy of testing above 170.00. But in 2024, with a full head of steam in April after the US CPI print, EUR/JPY was finally able to jump above that price, and it didn’t pullback below until July following another important US CPI print. That second CPI report pushed the prospect of US rate cuts and quickly Yen carry trades were unwinding, EUR/JPY included.
Ultimately it was the 155.00 level that stood in as support in August of last year and then again in February of this year, and since that second test, bulls have very much been in control of the trend with prices testing yet another fresh yearly high.
There was a bit of opportunity for bulls on the long side of the pair in late-July and early-August, as a pullback to that 170.00 level came into play around the FOMC and BoJ rate decisions, along with a higher-low in the following week after which buyers took control for much of the month of August. As we trade into September, buyers are again vying for another fresh high in the pair and the next major level sitting overhead is the 175.00 psychological level. For support, it’s the zone around the 76.4 and 78.6% Fibonacci retracements that had set prior resistance that remains of interest.
EUR/JPY Daily Chart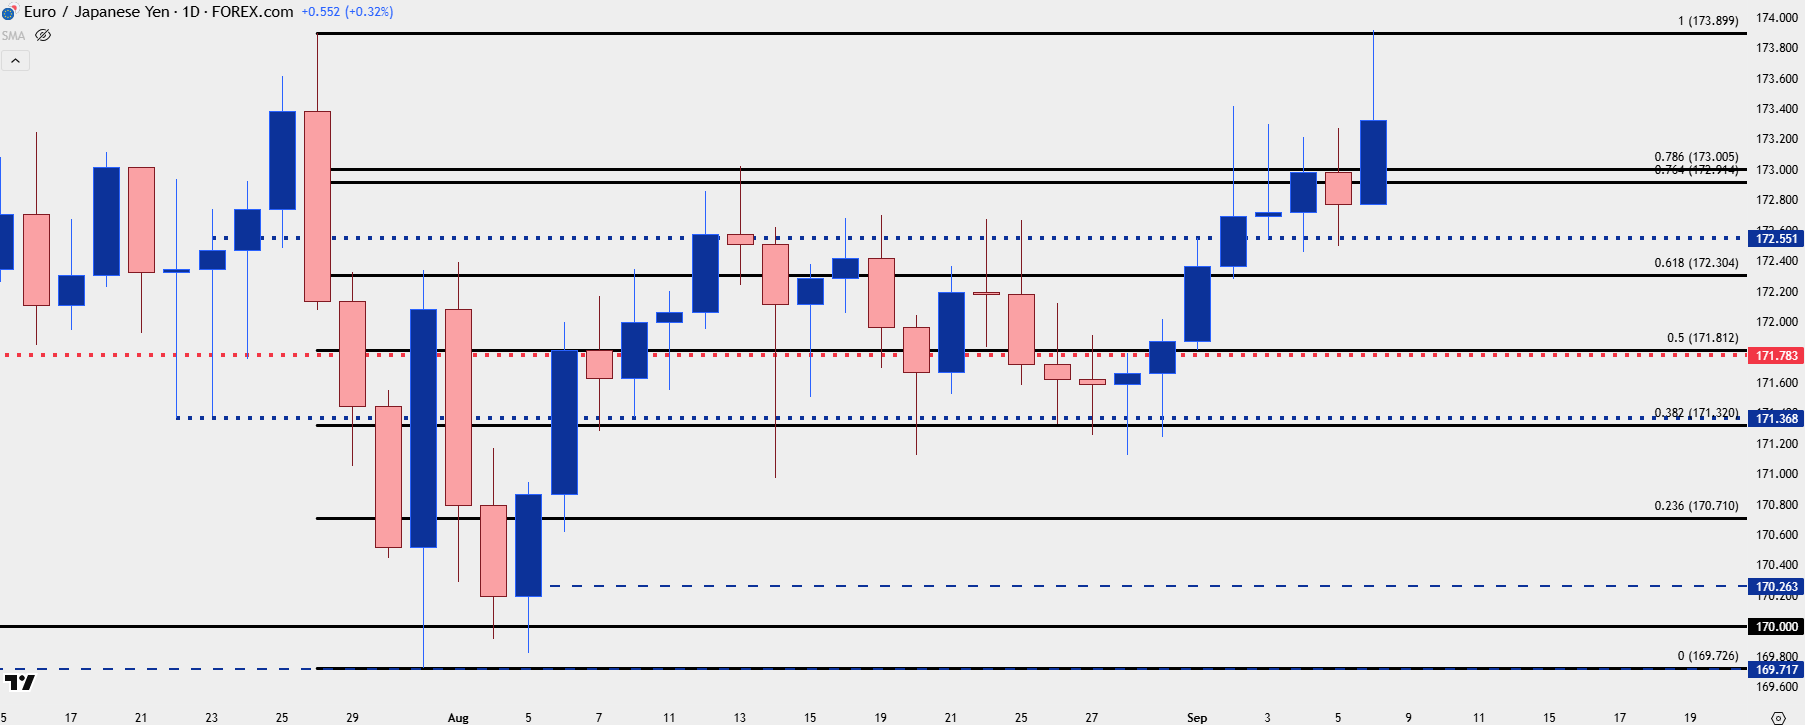
Chart prepared by James Stanley; data derived from Tradingview
GBP/JPY
There’s some nuance at work in GBP/JPY at the moment as the pair once again tests the psychological level at 200.00. That’s been a story since back in July, when GBP/JPY came 2.5 pips away from the level before snapping back. More recently, however, there’s been higher-lows since the late-August test at 198.08, and this morning brought a slightly higher-high, indicating that bulls are breaking through a little bit more on recurrent trips above 200.00.
The question now is whether another higher-low can hold and then related, whether one of these next tests above 200.00 brings on a continuation of bullish momentum. For now, I’m tracking supports at 199.28 and 198.94. There could even be a justifiable case for support at 198.60 if or when that comes into play.
GBP/JPY Daily Chart
Chart prepared by James Stanley; data derived from Tradingview
--- written by James Stanley, Senior Strategist
Related tags:
Latest market news




The complete CFD trading experience
Award-winning platforms, competitive spreads, low commissions and dedicated support.
We live and breathe the markets and are dedicated to helping traders realise their ambitions as we continue to set the industry bar.
Economic calendar
Web Trader platform
Our sophisticated web-based platform is packed with features.
Related articles
USD/JPY Analysis: Rising U.S. Yields Leave the Yen on the Defensive
As the first week of November progresses, renewed weakness in the Japanese yen is once again becoming evident in the short term. This dynamic can be seen in the recent performance of USD/JPY, which has posted two consecutive bullish sessions and gained more than 0.7%, reflecting a return of buying interest in the dollar while the yen continues to lose momentum.

Gold Rallies Towards a $4k Test – but Can Bulls Break the Trend?
Gold prices melted down last week but so far this week, a different tone has taken over. But can this turn into anything more than a short squeeze?

EUR/USD Clings to Support as Lagarde Announces Early Departure
EUR/USD has been mired in a steep sell-off as worries have built around French yields, but continued support around the 1.1100 level give hope for a bounce that could possibly turn into something more.
StoneX Europe Ltd may make third party material available on this website which may contain information included but not limited to the conditions of financial markets. The material is for information purposes only and does not contain, and should not be construed as containing, investment advice and/or investment recommendation and/or an investment research and/or an offer of or solicitation for any transactions in financial instruments; any decision to enter into a specific transaction shall be made by the client following an assessment by him/her of their situation.
StoneX Europe Ltd makes no representation or warranty and assumes no liability as to the accuracy or completeness of the information provided, nor any loss arising from any investment based on a recommendation, forecast or other information supplied. You should always seek independent advice as to your suitability to speculate in any related markets and your ability to assume the associated risks, if you are at all unsure. We are not under any obligation to update any such material. Any opinion made may be personal to the author and may not reflect the opinion of StoneX Europe Ltd.