Equities Talking Points:
- The week is still early but already there’s been massive volatility in equities, with an initial gap-down faded aggressively on news of a possible 90-day pause in tariff implementation.
- That 90-day pause in tariff implementation was quickly walked back by the White House, and stocks pulled back down again in response. But, at this point, stocks are holding higher-lows off the overnight swings and S&P 500 futures are holding very near last week’s close.
The wild ride through global markets continues through the weekly open. While the weekend was punctuated with Jim Cramer calling for another ‘Black Monday’ or Bill Ackman warning that President Trump needed to tone down the tariff rhetoric, price action in stocks so far probably hasn’t been as bad as many expected. Sure, there was a gap down and an initial thrust lower in futures last night. But, at this point, that swing low from the open yesterday is the peak low, and there’s since been two higher-lows that have built after that.
The weekly opening gap has been filled but there was a bit of noise setting that up: A rumor quickly circulated across the media that the Trump administration was considering a 90-day pause on tariff implementation. Shorts were quickly squeezed as equities rallied in a big way, with the S&P 500 putting in a max move of +9.41% from the overnight lows.
That report was walked back shortly after, however, and prices sank again – but to this point, they have held support at prior resistance which can keep the door open for a wider pullback.
I talked about stocks in this week’s equity forecast and as I highlighted there, we’ve seen oversold conditions on the weekly chart of the S&P 500 for the first time in over a year. The sell-off last week was intense, and it’s difficult to chase those moves lower given the quick imbalance of sellers that’s entered the market; so there can be a short squeeze type of backdrop, especially on headline-driven scenarios such as we’ve seen so far this morning.
S&P 500 30-Minute Price Chart
 Chart prepared by James Stanley; data derived from Tradingview
S&P Bigger Picture
Given the pandemonium in the headlines, it’s probably going to be difficult to attach to any trends in the near-term, as directional moves could quickly be swashed away by the next comment or social media item.
Swing trading, however, could at least present the opportunity for asymmetry so that if the trader does find themselves on the ‘right’ side of a move, the benefit could outweigh the risk outlay.
There are already some big levels in play on the S&P 500, as it’s the 50% retracement of the 2022-2025 major move that has so far set the low for this week. And the 38.2% retracement is currently in-play as short-term resistance as you can see from the above 30-minute chart.
S&P 500 Weekly Price Chart
 Chart prepared by James Stanley; data derived from Tradingview
From the daily chart, we can glimpse a couple of additional levels that remain important: The 5k level is a key area for bulls to try to defend if they did want to prolong the pullback, and overhead, the daily high at 5286 is the spot that they would need to take-out to take more control of the move. Above that, it’s the 5537 Fibonacci level that remains key as this set support in March over a few days and again last Monday before sellers were ultimately able to take it out. That’s now resistance potential on prolonged pullback/short squeeze scenarios.
S&P 500 Daily Price Chart
 Chart prepared by James Stanley; data derived from Tradingview
Nasdaq 100
The Nasdaq has also found support at the 50% retracement of its 2022-2025 major move and that’s led to a sizable bounce so far. Resistance, however, has held from another key level as taken from the 50% mark of the 2023-2025 major move, which is also a swing low from last September, plotting from around 18.283.
Nasdaq 100 Weekly Price Chart
 Chart prepared by James Stanley; data derived from Tradingview
Nasdaq Shorter-Term
From the four-hour chart we can glean a few additional levels of note, as the 61.8% retracement of the shorter-term move is now set up for support potential at 17,305. For resistance, there’s the 38.2% marker of the longer-term move at 17,864 and if bulls can rally through that, the 18,283 level is opened up for another test, which is what buyers would need to overcome to take greater control of the move.
I realize that given the headlines the upside of either scenario may seem an outlandish prospect, but with how aggressively bears hit this last week, given the stall so far this week, there could be a drive towards profit taking which could lead to a stronger short-squeeze situation.
As for whether this is a long-term bottom, that question would likely have something do with bonds as it seems a clear motive of the administration is to lower Treasury yields. And with the 10-year trading around 4%, there would be a lot of room for bond yields to move lower (and prices higher) if the anticipation was that Treasury yields would continue to fall on the back of the tariff campaign.
Nasdaq 100 Four-Hour Chart
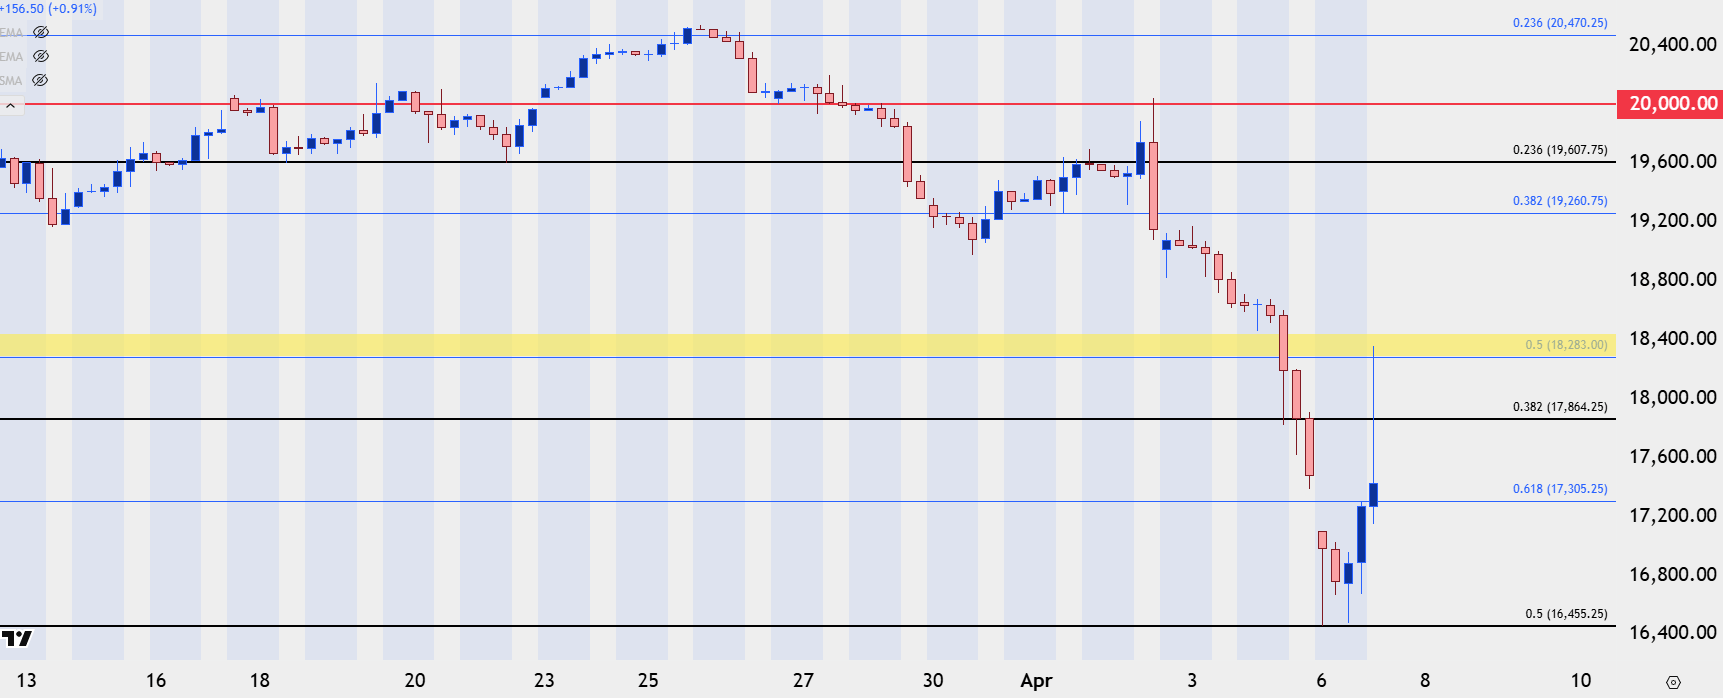 Chart prepared by James Stanley; data derived from Tradingview
--- written by James Stanley, Senior Strategist
This content will only appear on City Index websites!
Equities Talking Points:
- The week is still early but already there’s been massive volatility in equities, with an initial gap-down faded aggressively on news of a possible 90-day pause in tariff implementation.
- That 90-day pause in tariff implementation was quickly walked back by the White House, and stocks pulled back down again in response. But, at this point, stocks are holding higher-lows off the overnight swings and S&P 500 futures are holding very near last week’s close.
The wild ride through global markets continues through the weekly open. While the weekend was punctuated with Jim Cramer calling for another ‘Black Monday’ or Bill Ackman warning that President Trump needed to tone down the tariff rhetoric, price action in stocks so far probably hasn’t been as bad as many expected. Sure, there was a gap down and an initial thrust lower in futures last night. But, at this point, that swing low from the open yesterday is the peak low, and there’s since been two higher-lows that have built after that.
The weekly opening gap has been filled but there was a bit of noise setting that up: A rumor quickly circulated across the media that the Trump administration was considering a 90-day pause on tariff implementation. Shorts were quickly squeezed as equities rallied in a big way, with the S&P 500 putting in a max move of +9.41% from the overnight lows.
That report was walked back shortly after, however, and prices sank again – but to this point, they have held support at prior resistance which can keep the door open for a wider pullback.
I talked about stocks in this week’s equity forecast and as I highlighted there, we’ve seen oversold conditions on the weekly chart of the S&P 500 for the first time in over a year. The sell-off last week was intense, and it’s difficult to chase those moves lower given the quick imbalance of sellers that’s entered the market; so there can be a short squeeze type of backdrop, especially on headline-driven scenarios such as we’ve seen so far this morning.
S&P 500 30-Minute Price Chart
Chart prepared by James Stanley; data derived from Tradingview
S&P Bigger Picture
Given the pandemonium in the headlines, it’s probably going to be difficult to attach to any trends in the near-term, as directional moves could quickly be swashed away by the next comment or social media item.
Swing trading, however, could at least present the opportunity for asymmetry so that if the trader does find themselves on the ‘right’ side of a move, the benefit could outweigh the risk outlay.
There are already some big levels in play on the S&P 500, as it’s the 50% retracement of the 2022-2025 major move that has so far set the low for this week. And the 38.2% retracement is currently in-play as short-term resistance as you can see from the above 30-minute chart.
S&P 500 Weekly Price Chart
Chart prepared by James Stanley; data derived from Tradingview
From the daily chart, we can glimpse a couple of additional levels that remain important: The 5k level is a key area for bulls to try to defend if they did want to prolong the pullback, and overhead, the daily high at 5286 is the spot that they would need to take-out to take more control of the move. Above that, it’s the 5537 Fibonacci level that remains key as this set support in March over a few days and again last Monday before sellers were ultimately able to take it out. That’s now resistance potential on prolonged pullback/short squeeze scenarios.
S&P 500 Daily Price Chart
Chart prepared by James Stanley; data derived from Tradingview
Nasdaq 100
The Nasdaq has also found support at the 50% retracement of its 2022-2025 major move and that’s led to a sizable bounce so far. Resistance, however, has held from another key level as taken from the 50% mark of the 2023-2025 major move, which is also a swing low from last September, plotting from around 18.283.
Nasdaq 100 Weekly Price Chart
Chart prepared by James Stanley; data derived from Tradingview
Nasdaq Shorter-Term
From the four-hour chart we can glean a few additional levels of note, as the 61.8% retracement of the shorter-term move is now set up for support potential at 17,305. For resistance, there’s the 38.2% marker of the longer-term move at 17,864 and if bulls can rally through that, the 18,283 level is opened up for another test, which is what buyers would need to overcome to take greater control of the move.
I realize that given the headlines the upside of either scenario may seem an outlandish prospect, but with how aggressively bears hit this last week, given the stall so far this week, there could be a drive towards profit taking which could lead to a stronger short-squeeze situation.
As for whether this is a long-term bottom, that question would likely have something do with bonds as it seems a clear motive of the administration is to lower Treasury yields. And with the 10-year trading around 4%, there would be a lot of room for bond yields to move lower (and prices higher) if the anticipation was that Treasury yields would continue to fall on the back of the tariff campaign.
Nasdaq 100 Four-Hour Chart
Chart prepared by James Stanley; data derived from Tradingview
--- written by James Stanley, Senior Strategist
Equities Talking Points:
- The week is still early but already there’s been massive volatility in equities, with an initial gap-down faded aggressively on news of a possible 90-day pause in tariff implementation.
- That 90-day pause in tariff implementation was quickly walked back by the White House, and stocks pulled back down again in response. But, at this point, stocks are holding higher-lows off the overnight swings and S&P 500 futures are holding very near last week’s close.
Indices AD
The wild ride through global markets continues through the weekly open. While the weekend was punctuated with Jim Cramer calling for another ‘Black Monday’ or Bill Ackman warning that President Trump needed to tone down the tariff rhetoric, price action in stocks so far probably hasn’t been as bad as many expected. Sure, there was a gap down and an initial thrust lower in futures last night. But, at this point, that swing low from the open yesterday is the peak low, and there’s since been two higher-lows that have built after that.
The weekly opening gap has been filled but there was a bit of noise setting that up: A rumor quickly circulated across the media that the Trump administration was considering a 90-day pause on tariff implementation. Shorts were quickly squeezed as equities rallied in a big way, with the S&P 500 putting in a max move of +9.41% from the overnight lows.
That report was walked back shortly after, however, and prices sank again – but to this point, they have held support at prior resistance which can keep the door open for a wider pullback.
I talked about stocks in this week’s equity forecast and as I highlighted there, we’ve seen oversold conditions on the weekly chart of the S&P 500 for the first time in over a year. The sell-off last week was intense, and it’s difficult to chase those moves lower given the quick imbalance of sellers that’s entered the market; so there can be a short squeeze type of backdrop, especially on headline-driven scenarios such as we’ve seen so far this morning.
S&P 500 30-Minute Price Chart
Chart prepared by James Stanley; data derived from Tradingview
S&P Bigger Picture
Given the pandemonium in the headlines, it’s probably going to be difficult to attach to any trends in the near-term, as directional moves could quickly be swashed away by the next comment or social media item.
Swing trading, however, could at least present the opportunity for asymmetry so that if the trader does find themselves on the ‘right’ side of a move, the benefit could outweigh the risk outlay.
There are already some big levels in play on the S&P 500, as it’s the 50% retracement of the 2022-2025 major move that has so far set the low for this week. And the 38.2% retracement is currently in-play as short-term resistance as you can see from the above 30-minute chart.
S&P 500 Weekly Price Chart
Chart prepared by James Stanley; data derived from Tradingview
From the daily chart, we can glimpse a couple of additional levels that remain important: The 5k level is a key area for bulls to try to defend if they did want to prolong the pullback, and overhead, the daily high at 5286 is the spot that they would need to take-out to take more control of the move. Above that, it’s the 5537 Fibonacci level that remains key as this set support in March over a few days and again last Monday before sellers were ultimately able to take it out. That’s now resistance potential on prolonged pullback/short squeeze scenarios.
S&P 500 Daily Price Chart
Chart prepared by James Stanley; data derived from Tradingview
Nasdaq 100
The Nasdaq has also found support at the 50% retracement of its 2022-2025 major move and that’s led to a sizable bounce so far. Resistance, however, has held from another key level as taken from the 50% mark of the 2023-2025 major move, which is also a swing low from last September, plotting from around 18.283.
Nasdaq 100 Weekly Price Chart
Chart prepared by James Stanley; data derived from Tradingview
Nasdaq Shorter-Term
From the four-hour chart we can glean a few additional levels of note, as the 61.8% retracement of the shorter-term move is now set up for support potential at 17,305. For resistance, there’s the 38.2% marker of the longer-term move at 17,864 and if bulls can rally through that, the 18,283 level is opened up for another test, which is what buyers would need to overcome to take greater control of the move.
I realize that given the headlines the upside of either scenario may seem an outlandish prospect, but with how aggressively bears hit this last week, given the stall so far this week, there could be a drive towards profit taking which could lead to a stronger short-squeeze situation.
As for whether this is a long-term bottom, that question would likely have something do with bonds as it seems a clear motive of the administration is to lower Treasury yields. And with the 10-year trading around 4%, there would be a lot of room for bond yields to move lower (and prices higher) if the anticipation was that Treasury yields would continue to fall on the back of the tariff campaign.
Nasdaq 100 Four-Hour Chart
Chart prepared by James Stanley; data derived from Tradingview
--- written by James Stanley, Senior Strategist
Equities Talking Points:
- The week is still early but already there’s been massive volatility in equities, with an initial gap-down faded aggressively on news of a possible 90-day pause in tariff implementation.
- That 90-day pause in tariff implementation was quickly walked back by the White House, and stocks pulled back down again in response. But, at this point, stocks are holding higher-lows off the overnight swings and S&P 500 futures are holding very near last week’s close.
Indices AD
The wild ride through global markets continues through the weekly open. While the weekend was punctuated with Jim Cramer calling for another ‘Black Monday’ or Bill Ackman warning that President Trump needed to tone down the tariff rhetoric, price action in stocks so far probably hasn’t been as bad as many expected. Sure, there was a gap down and an initial thrust lower in futures last night. But, at this point, that swing low from the open yesterday is the peak low, and there’s since been two higher-lows that have built after that.
The weekly opening gap has been filled but there was a bit of noise setting that up: A rumor quickly circulated across the media that the Trump administration was considering a 90-day pause on tariff implementation. Shorts were quickly squeezed as equities rallied in a big way, with the S&P 500 putting in a max move of +9.41% from the overnight lows.
That report was walked back shortly after, however, and prices sank again – but to this point, they have held support at prior resistance which can keep the door open for a wider pullback.
I talked about stocks in this week’s equity forecast and as I highlighted there, we’ve seen oversold conditions on the weekly chart of the S&P 500 for the first time in over a year. The sell-off last week was intense, and it’s difficult to chase those moves lower given the quick imbalance of sellers that’s entered the market; so there can be a short squeeze type of backdrop, especially on headline-driven scenarios such as we’ve seen so far this morning.
S&P 500 30-Minute Price Chart
Chart prepared by James Stanley; data derived from Tradingview
S&P Bigger Picture
Given the pandemonium in the headlines, it’s probably going to be difficult to attach to any trends in the near-term, as directional moves could quickly be swashed away by the next comment or social media item.
Swing trading, however, could at least present the opportunity for asymmetry so that if the trader does find themselves on the ‘right’ side of a move, the benefit could outweigh the risk outlay.
There are already some big levels in play on the S&P 500, as it’s the 50% retracement of the 2022-2025 major move that has so far set the low for this week. And the 38.2% retracement is currently in-play as short-term resistance as you can see from the above 30-minute chart.
S&P 500 Weekly Price Chart
Chart prepared by James Stanley; data derived from Tradingview
From the daily chart, we can glimpse a couple of additional levels that remain important: The 5k level is a key area for bulls to try to defend if they did want to prolong the pullback, and overhead, the daily high at 5286 is the spot that they would need to take-out to take more control of the move. Above that, it’s the 5537 Fibonacci level that remains key as this set support in March over a few days and again last Monday before sellers were ultimately able to take it out. That’s now resistance potential on prolonged pullback/short squeeze scenarios.
S&P 500 Daily Price Chart
Chart prepared by James Stanley; data derived from Tradingview
Nasdaq 100
The Nasdaq has also found support at the 50% retracement of its 2022-2025 major move and that’s led to a sizable bounce so far. Resistance, however, has held from another key level as taken from the 50% mark of the 2023-2025 major move, which is also a swing low from last September, plotting from around 18.283.
Nasdaq 100 Weekly Price Chart
Chart prepared by James Stanley; data derived from Tradingview
Nasdaq Shorter-Term
From the four-hour chart we can glean a few additional levels of note, as the 61.8% retracement of the shorter-term move is now set up for support potential at 17,305. For resistance, there’s the 38.2% marker of the longer-term move at 17,864 and if bulls can rally through that, the 18,283 level is opened up for another test, which is what buyers would need to overcome to take greater control of the move.
I realize that given the headlines the upside of either scenario may seem an outlandish prospect, but with how aggressively bears hit this last week, given the stall so far this week, there could be a drive towards profit taking which could lead to a stronger short-squeeze situation.
As for whether this is a long-term bottom, that question would likely have something do with bonds as it seems a clear motive of the administration is to lower Treasury yields. And with the 10-year trading around 4%, there would be a lot of room for bond yields to move lower (and prices higher) if the anticipation was that Treasury yields would continue to fall on the back of the tariff campaign.
Nasdaq 100 Four-Hour Chart
Chart prepared by James Stanley; data derived from Tradingview
--- written by James Stanley, Senior Strategist
Equities Talking Points:
- The week is still early but already there’s been massive volatility in equities, with an initial gap-down faded aggressively on news of a possible 90-day pause in tariff implementation.
- That 90-day pause in tariff implementation was quickly walked back by the White House, and stocks pulled back down again in response. But, at this point, stocks are holding higher-lows off the overnight swings and S&P 500 futures are holding very near last week’s close.
Indices AD
The wild ride through global markets continues through the weekly open. While the weekend was punctuated with Jim Cramer calling for another ‘Black Monday’ or Bill Ackman warning that President Trump needed to tone down the tariff rhetoric, price action in stocks so far probably hasn’t been as bad as many expected. Sure, there was a gap down and an initial thrust lower in futures last night. But, at this point, that swing low from the open yesterday is the peak low, and there’s since been two higher-lows that have built after that.
The weekly opening gap has been filled but there was a bit of noise setting that up: A rumor quickly circulated across the media that the Trump administration was considering a 90-day pause on tariff implementation. Shorts were quickly squeezed as equities rallied in a big way, with the S&P 500 putting in a max move of +9.41% from the overnight lows.
That report was walked back shortly after, however, and prices sank again – but to this point, they have held support at prior resistance which can keep the door open for a wider pullback.
I talked about stocks in this week’s equity forecast and as I highlighted there, we’ve seen oversold conditions on the weekly chart of the S&P 500 for the first time in over a year. The sell-off last week was intense, and it’s difficult to chase those moves lower given the quick imbalance of sellers that’s entered the market; so there can be a short squeeze type of backdrop, especially on headline-driven scenarios such as we’ve seen so far this morning.
S&P 500 30-Minute Price Chart
Chart prepared by James Stanley; data derived from Tradingview
S&P Bigger Picture
Given the pandemonium in the headlines, it’s probably going to be difficult to attach to any trends in the near-term, as directional moves could quickly be swashed away by the next comment or social media item.
Swing trading, however, could at least present the opportunity for asymmetry so that if the trader does find themselves on the ‘right’ side of a move, the benefit could outweigh the risk outlay.
There are already some big levels in play on the S&P 500, as it’s the 50% retracement of the 2022-2025 major move that has so far set the low for this week. And the 38.2% retracement is currently in-play as short-term resistance as you can see from the above 30-minute chart.
S&P 500 Weekly Price Chart
Chart prepared by James Stanley; data derived from Tradingview
From the daily chart, we can glimpse a couple of additional levels that remain important: The 5k level is a key area for bulls to try to defend if they did want to prolong the pullback, and overhead, the daily high at 5286 is the spot that they would need to take-out to take more control of the move. Above that, it’s the 5537 Fibonacci level that remains key as this set support in March over a few days and again last Monday before sellers were ultimately able to take it out. That’s now resistance potential on prolonged pullback/short squeeze scenarios.
S&P 500 Daily Price Chart
Chart prepared by James Stanley; data derived from Tradingview
Nasdaq 100
The Nasdaq has also found support at the 50% retracement of its 2022-2025 major move and that’s led to a sizable bounce so far. Resistance, however, has held from another key level as taken from the 50% mark of the 2023-2025 major move, which is also a swing low from last September, plotting from around 18.283.
Nasdaq 100 Weekly Price Chart
Chart prepared by James Stanley; data derived from Tradingview
Nasdaq Shorter-Term
From the four-hour chart we can glean a few additional levels of note, as the 61.8% retracement of the shorter-term move is now set up for support potential at 17,305. For resistance, there’s the 38.2% marker of the longer-term move at 17,864 and if bulls can rally through that, the 18,283 level is opened up for another test, which is what buyers would need to overcome to take greater control of the move.
I realize that given the headlines the upside of either scenario may seem an outlandish prospect, but with how aggressively bears hit this last week, given the stall so far this week, there could be a drive towards profit taking which could lead to a stronger short-squeeze situation.
As for whether this is a long-term bottom, that question would likely have something do with bonds as it seems a clear motive of the administration is to lower Treasury yields. And with the 10-year trading around 4%, there would be a lot of room for bond yields to move lower (and prices higher) if the anticipation was that Treasury yields would continue to fall on the back of the tariff campaign.
Nasdaq 100 Four-Hour Chart
Chart prepared by James Stanley; data derived from Tradingview
--- written by James Stanley, Senior Strategist











