



US CPI: Highest level in nearly 30 years! Gold near 5-month highs
IF CPI and PPI continue to come in stronger than expected, the inflation-hedge assets should continue to move higher
Share this:

Yesterday, after US PPI was released at its highest levels since November 2010, PPI turned to CPI and said, “Beat that!” Well, US CPI responded to the challenge and reported its highest level since November 1990! The headline YoY CPI print for October was 6.2% vs an expectation of 5.8% and a September reading of 5.4%, mainly driven my higher energy costs. For the core print, which strips out food an energy, the reading was 4.6% vs 4.3% expected and 4% last.
Both readings are much higher than the Fed’s 2% target as traders are left to wonder how much of the inflation is really “transitory”. Traders also need to question how much of this inflation will have an impact on the overall economy. Moments after the CPI print, markets moved to pricing in a near 46% chance of a rate hike in June 2022.

Source: CME, Stone X
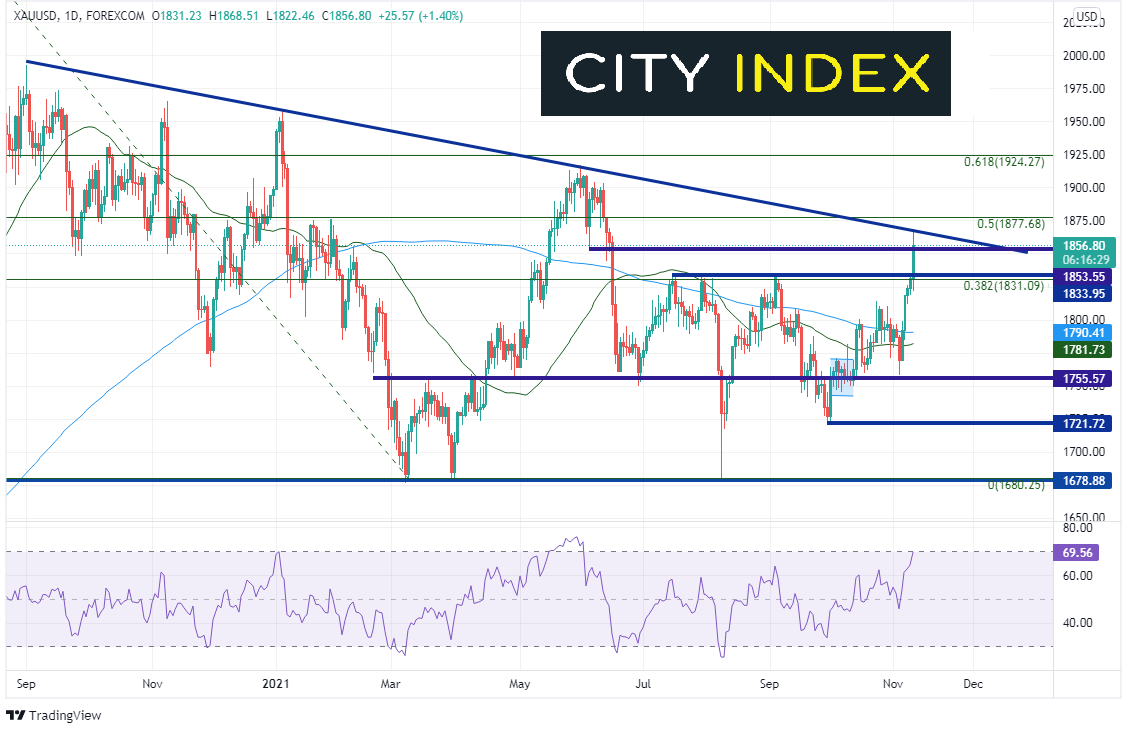
Gold (XAU/USD) has been moving higher over the last 4 days. After the release of the CPI print, Gold sprinted even higher, ripping through previous highs and the 38.2% Fibonacci retracement, from the August 2020 highs to the August 2021 lows, to its highest level since June 17th. Gold also broke through prior lows at 1853.55 as well. The next resistance is at the downward sloping trendline dating back to September 1st, 2020 near 1869 and then the 50% retracement from the previously mentioned high at 1877.68.

Source: Tradingview, Stone X
Trade Gold now: Login or open a new account!
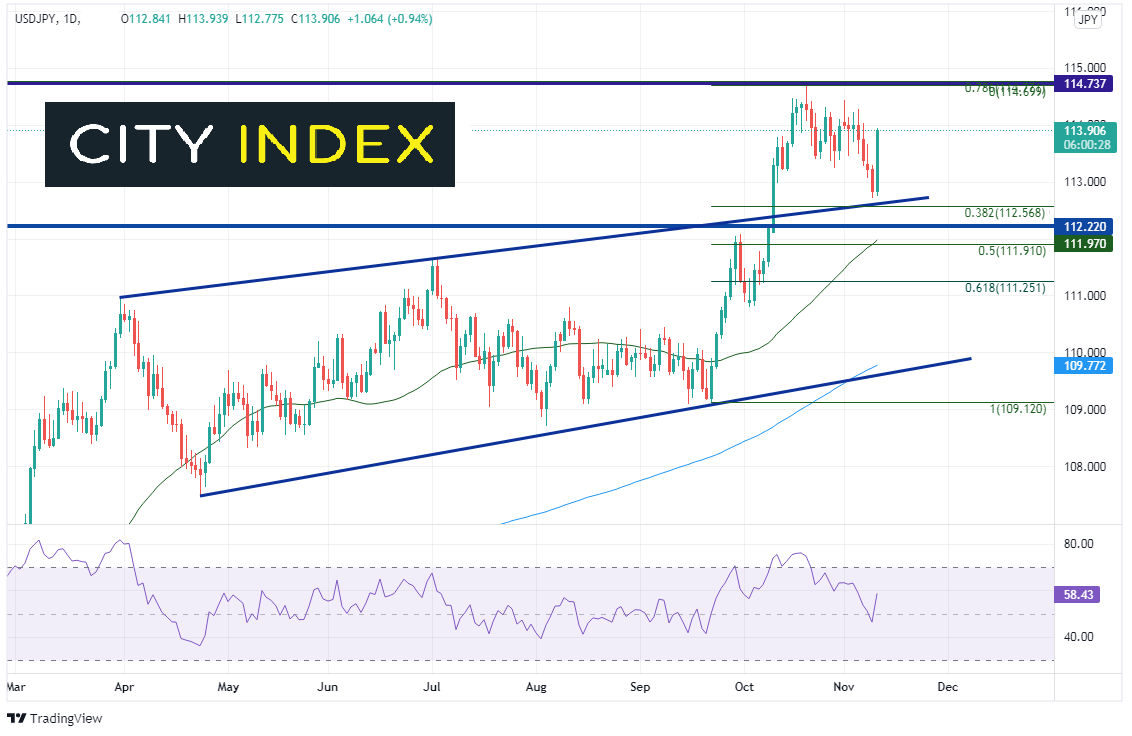
As gold moved higher, so did USD/JPY and the DXY: exactly as one would expect from a higher inflation reading. USD/JPY bounced off the support level we had discussed yesterday, near the rising trendline and the 38.2% Fibonacci retracement level from the September 22nd lows to the October 20th highs. Next resistance is at the October 20th highs of 114.75.

Source: Tradingview, Stone X
Trade USD/JPY now: Login or open a new account!
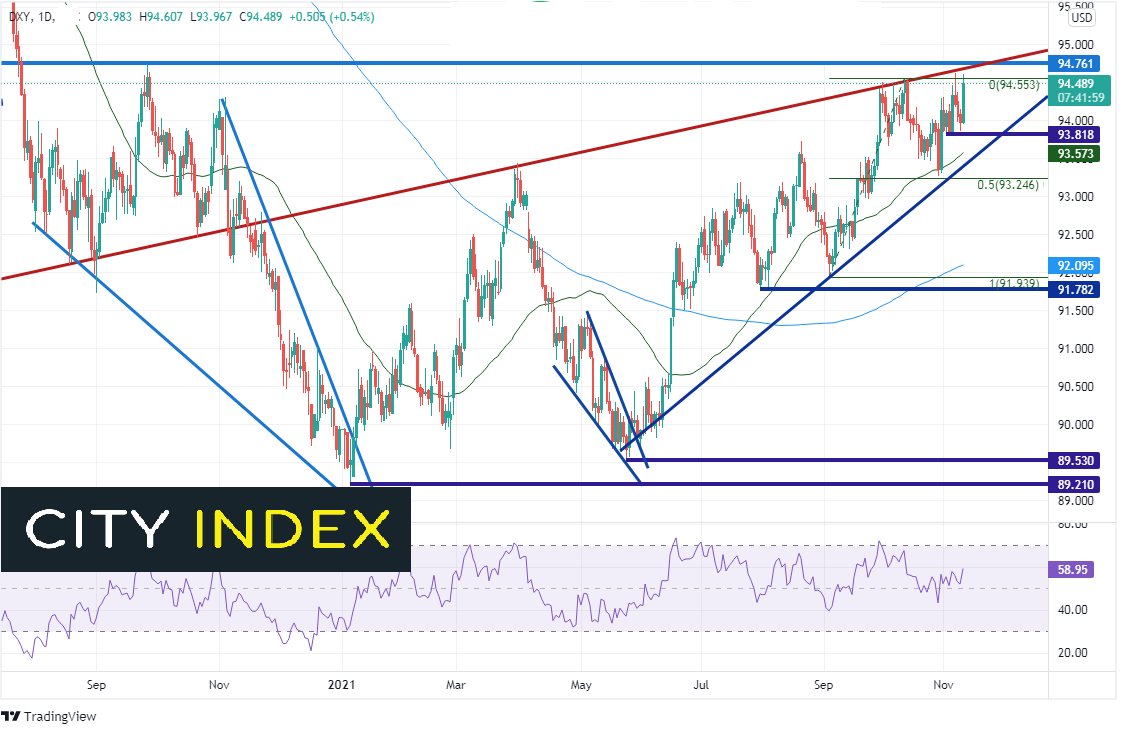
The US Dollar Index (DXY) is also testing new yearly all-time highs. The previous high from November 5th was 94.62. Today’s high thus far is 94.60. There is immediate resistance above at the upward sloping trendline dating back to 2011 (red) near 94.70, just ahead of horizontal resistance from September of last year at 94.76. First support is down at the November 2nd lows of 93.18, then the 50 Day Moving Average at 93.57, followed by a convergence of an upward sloping trendline, the October 28th lows, and the 50% retracement from the September 3rd lows to the October 12th highs at 93.25

Source: Tradingview, Stone X
CPI and PPI are only 2 indicators the Fed uses to measure inflation. However, if these readings continue to come in stronger than expected, the inflation-hedge assets should continue to move higher, which may also send stock indices lower!
Learn more about forex trading opportunities.
Yesterday, after US PPI was released at its highest levels since November 2010, PPI turned to CPI and said, “Beat that!” Well, US CPI responded to the challenge and reported its highest level since November 1990! The headline YoY CPI print for October was 6.2% vs an expectation of 5.8% and a September reading of 5.4%, mainly driven my higher energy costs. For the core print, which strips out food an energy, the reading was 4.6% vs 4.3% expected and 4% last.
Both readings are much higher than the Fed’s 2% target as traders are left to wonder how much of the inflation is really “transitory”. Traders also need to question how much of this inflation will have an impact on the overall economy. Moments after the CPI print, markets moved to pricing in a near 46% chance of a rate hike in June 2022.
Source: CME, Stone X
Gold (XAU/USD) has been moving higher over the last 4 days. After the release of the CPI print, Gold sprinted even higher, ripping through previous highs and the 38.2% Fibonacci retracement, from the August 2020 highs to the August 2021 lows, to its highest level since June 17th. Gold also broke through prior lows at 1853.55 as well. The next resistance is at the downward sloping trendline dating back to September 1st, 2020 near 1869 and then the 50% retracement from the previously mentioned high at 1877.68.
Source: Tradingview, Stone X
Trade Gold now: Login or Open a new account!
• Open an account in the UK
• Open an account in Australia
• Open an account in Singapore
As gold moved higher, so did USD/JPY and the DXY: exactly as one would expect from a higher inflation reading. USD/JPY bounced off the support level we had discussed yesterday, near the rising trendline and the 38.2% Fibonacci retracement level from the September 22nd lows to the October 20th highs. Next resistance is at the October 20th highs of 114.75.
Source: Tradingview, Stone X
Trade USD/JPY now: Login or Open a new account!
• Open an account in the UK
• Open an account in Australia
• Open an account in Singapore
The US Dollar Index (DXY) is also testing new yearly all-time highs. The previous high from November 5th was 94.62. Today’s high thus far is 94.60. There is immediate resistance above at the upward sloping trendline dating back to 2011 (red) near 94.70, just ahead of horizontal resistance from September of last year at 94.76. First support is down at the November 2nd lows of 93.18, then the 50 Day Moving Average at 93.57, followed by a convergence of an upward sloping trendline, the October 28th lows, and the 50% retracement from the September 3rd lows to the October 12th highs at 93.25.
Source: Tradingview, Stone X
CPI and PPI are only 2 indicators the Fed uses to measure inflation. However, if these readings continue to come in stronger than expected, the inflation-hedge assets should continue to move higher, which may also send stock indices lower!
Learn more about forex trading opportunities.
Related tags:


The complete CFD trading experience
Award-winning platforms, competitive spreads, low commissions and dedicated support.
We live and breathe the markets and are dedicated to helping traders realise their ambitions as we continue to set the industry bar.
Economic calendar
Web Trader platform
Our sophisticated web-based platform is packed with features.
Related articles
Gold Breaks Down on Descending Triangle, Sets Up $4k Test
Gold started last week with a strong sell-off but from that move a bounce developed. Bulls could not hold on through the weekly close, however, and the bearish structure remains in-place for XAU/USD.

USD/JPY weekly outlook: Quarter turn scrambles rates regime
USD/JPY’s tight relationship with front-end US rates broke down sharply last week, but quarter-turn flows and positioning suggest the disconnect may prove temporary.


Gold Update: XAU/USD Remains Under Pressure Even After the NFP Report
As the trading week comes to an end, weakness around gold price action remains evident in the short term. This can be seen in the performance of the past two sessions, where the metal has declined by approximately 0.3%. Although the move has not been particularly aggressive, it highlights that buying pressure continues to struggle to regain control of the market.

StoneX Europe Ltd may make third party material available on this website which may contain information included but not limited to the conditions of financial markets. The material is for information purposes only and does not contain, and should not be construed as containing, investment advice and/or investment recommendation and/or an investment research and/or an offer of or solicitation for any transactions in financial instruments; any decision to enter into a specific transaction shall be made by the client following an assessment by him/her of their situation.
StoneX Europe Ltd makes no representation or warranty and assumes no liability as to the accuracy or completeness of the information provided, nor any loss arising from any investment based on a recommendation, forecast or other information supplied. You should always seek independent advice as to your suitability to speculate in any related markets and your ability to assume the associated risks, if you are at all unsure. We are not under any obligation to update any such material. Any opinion made may be personal to the author and may not reflect the opinion of StoneX Europe Ltd.