



US Dollar Price Action Setups: USD/JPY, EUR/USD
It was a strong move for the US Dollar as USD/JPY pushed back-above the 160.00 level, and the question for next week is what policymakers want to do about it.
Share this:

US Dollar Talking Points:
- The US Dollar broke out after the hawkish lean from Kevin Warsh at the Jackson Hole Economic Symposium.
- This produced a pullback in EUR/USD and for those looking to fade the USD-strength, that setup could be of interest.

USD/JPY is heading into the weekly close above the 160.00 handle and this begs the question as to whether we’ll see a response from either the BoJ and/or the US Treasury Department next week.
Of late, the US Dollar has been heavily driven by dynamics in USD/JPY and the Friday breakout illustrates that well, with both DXY and USD/JPY pushing up to fresh August highs on the back of Kevin Warsh’s speech at Jackson Hole.
US Dollar Four-Hour Chart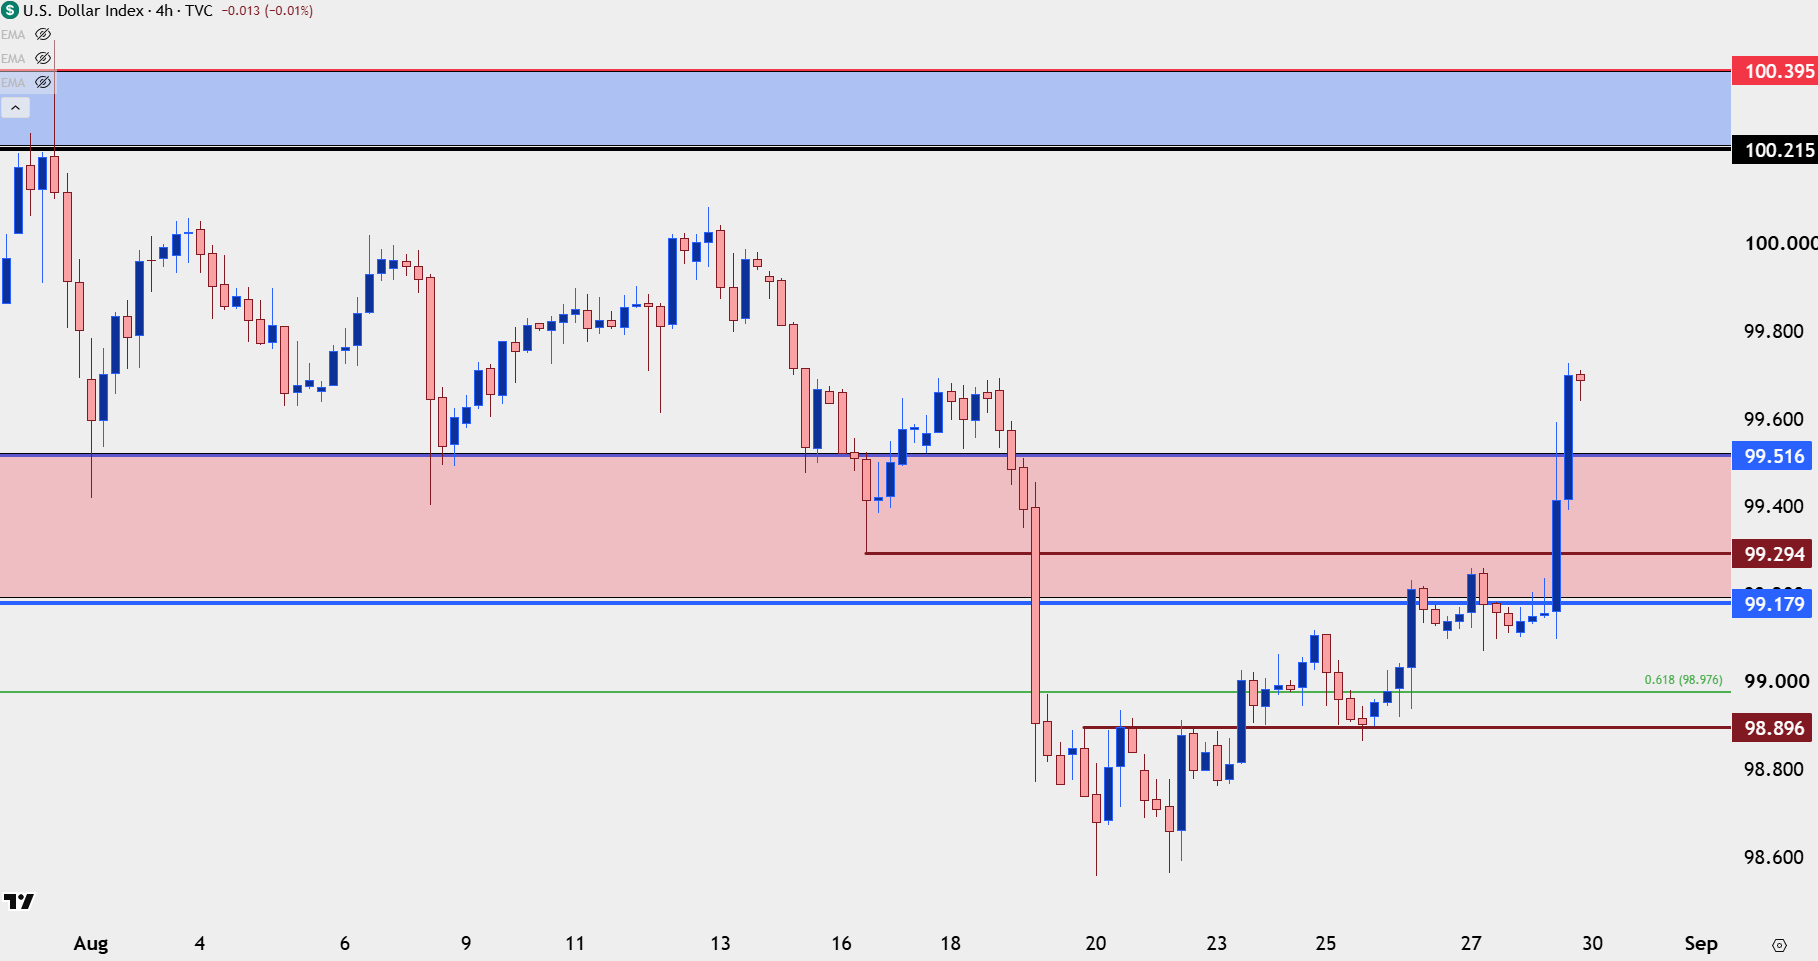
Chart prepared by James Stanley; data derived from Tradingview
USD/JPY
While 160.00 wasn’t a specific line in the sand set by policymakers, it was thought to be an important level that could possibly produce a response. Given the backdrop on Friday, with Kevin Warsh’s hawkish take at Jackson Hole driving a move of USD-strength, bulls finally mustered the motivation to test above the big figure despite posturing just below it for the prior two-and-a-half weeks.
As I had said in the Tuesday webinar, the pair was exhibiting continued higher-lows and that showed how buyers were continuing to respond to dips or pullbacks, and until there was a break in the fundamental backdrop, or a larger response from policymakers, that pace was likely to continue.
Friday marks a big test in that sequence as it’s the first push above the 160.00 level since the dual intervention. And like we’ve seen in prior episodes, now that bulls have broken through the seal the big question is for how long might they go until there is a response. The levels that I’ve been tracking are 160.64 and then 161.95, and above that is the same 164.00 that stalled the move ahead of the July FOMC and BoJ rate decisions and that’s what actually elicited a response.
USD/JPY Daily Chart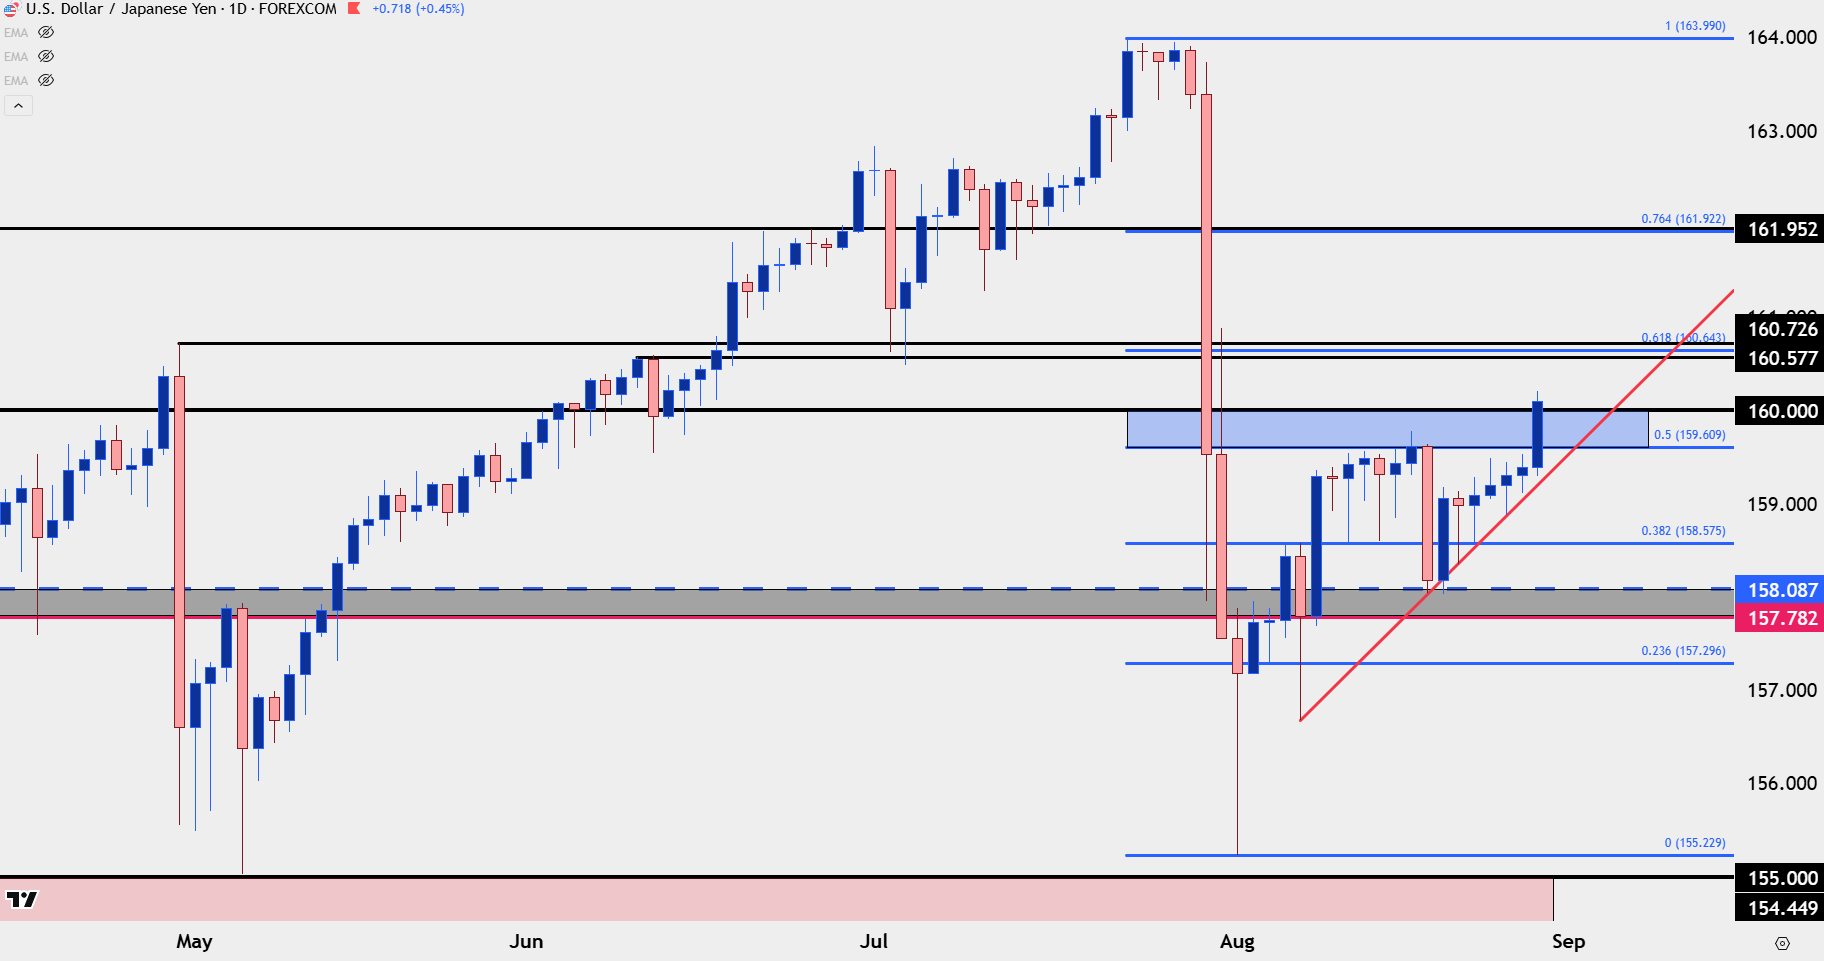
Chart prepared by James Stanley; data derived from Tradingview
EUR/USD
The move in EUR/USD has so far remained clean, with the 1.1576 support level holding the lows into the end of the week. This was resistance earlier in August before a breakout pushed a test of the 1.1700 handle, and for traders looking for USD-weakness that does not involve the hope of policy intervention, this could make for a compelling setup provided that support can hold through next week’s open.
EUR/USD Daily Price Chart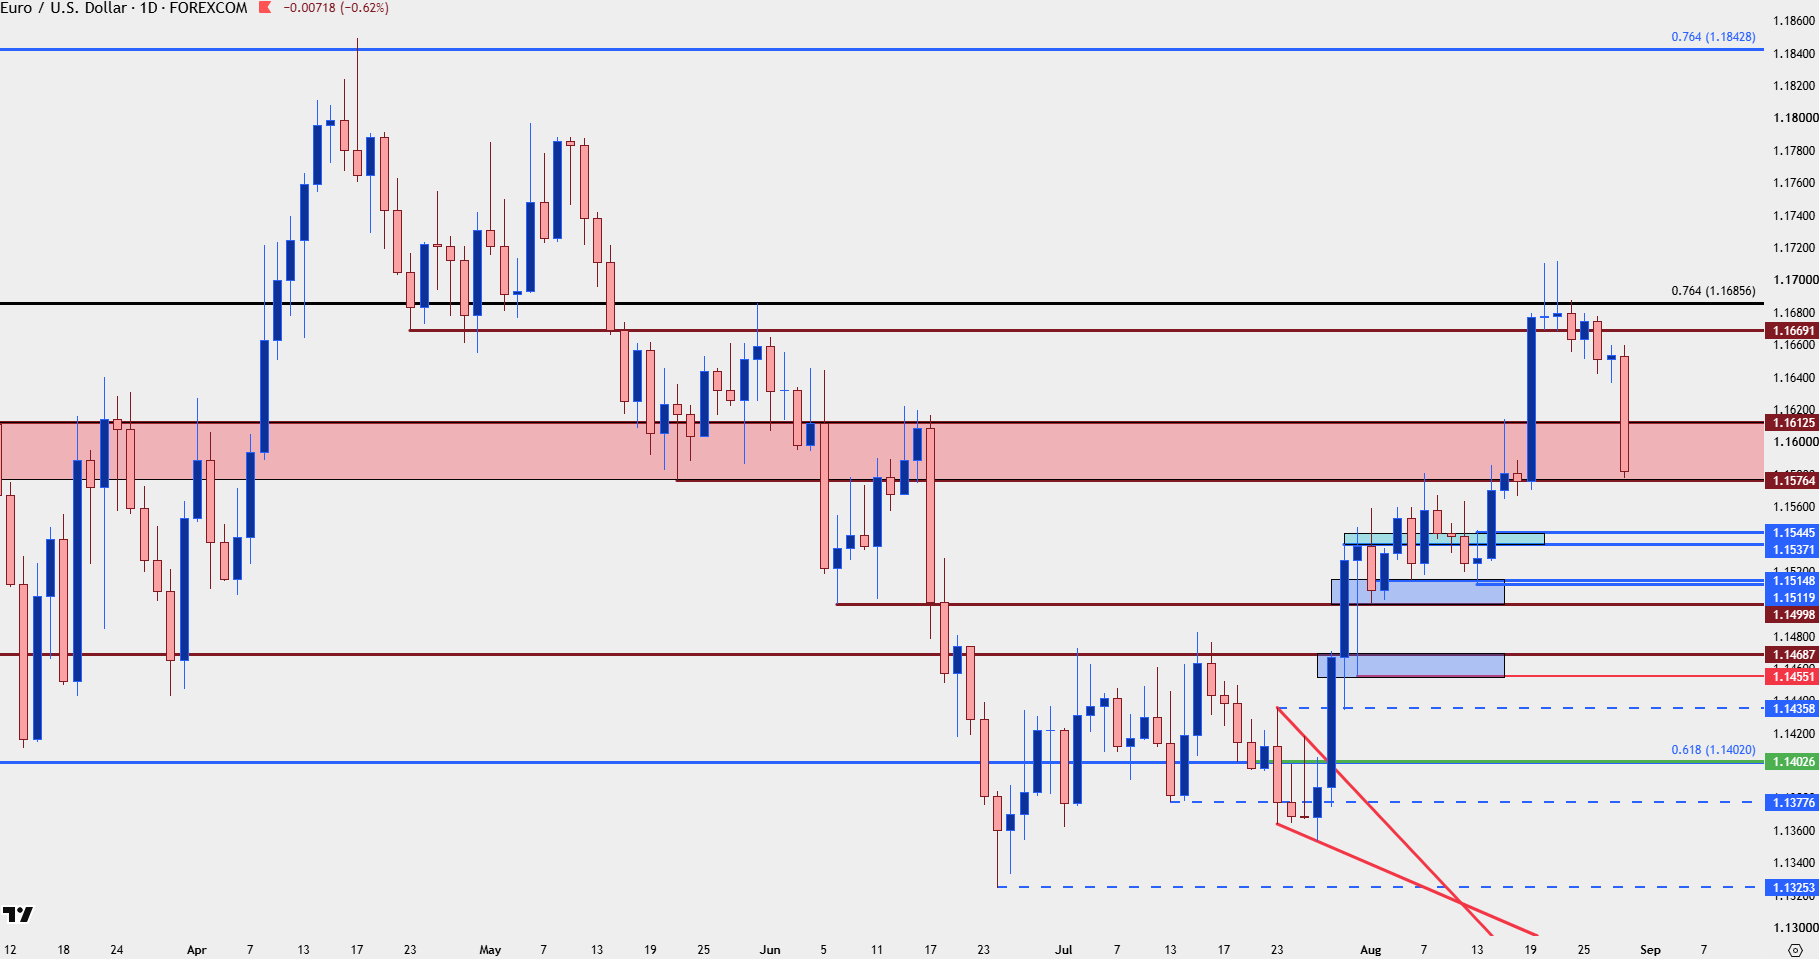
Chart prepared by James Stanley; data derived from Tradingview
--- written by James Stanley, Senior Market Analyst, Global Macro
Related tags:
Latest market news




The complete CFD trading experience
Award-winning platforms, competitive spreads, low commissions and dedicated support.
We live and breathe the markets and are dedicated to helping traders realise their ambitions as we continue to set the industry bar.
Economic calendar
Web Trader platform
Our sophisticated web-based platform is packed with features.
Related articles
S&P 500, Nasdaq, Dow and Russell 2000 For the Week Ahead
Stocks started to shake last week and there was even a hint of this in the prior week. The question now is whether we’re at the point where buyers may abandon pullbacks as get closer to mid-term elections.
Euro Technical Forecast: EUR/USD Snaps Five-Week Slide at Critical Support 10 17 2026
Euro is attempting to regain its footing as stretched momentum raises the stakes for the next move ahead of key PMI data and central bank decisions.


USD/JPY Weekly Outlook: Volatility Has Left the Building
The yen has ignored broad dollar weakness, falling Treasury yields and renewed market turbulence. Yet its relationship with US interest rates remains intact. So why is USD/JPY going absolutely nowhere fast?

StoneX Europe Ltd may make third party material available on this website which may contain information included but not limited to the conditions of financial markets. The material is for information purposes only and does not contain, and should not be construed as containing, investment advice and/or investment recommendation and/or an investment research and/or an offer of or solicitation for any transactions in financial instruments; any decision to enter into a specific transaction shall be made by the client following an assessment by him/her of their situation.
StoneX Europe Ltd makes no representation or warranty and assumes no liability as to the accuracy or completeness of the information provided, nor any loss arising from any investment based on a recommendation, forecast or other information supplied. You should always seek independent advice as to your suitability to speculate in any related markets and your ability to assume the associated risks, if you are at all unsure. We are not under any obligation to update any such material. Any opinion made may be personal to the author and may not reflect the opinion of StoneX Europe Ltd.