














VIX shorts rose to 6-month high ahead of Trump tariffs: COT report
Some bullish fingers have likely been burned at this week's open, given the relatively bullish positioning on S&P 500 futures alongside short bets against the VIX rising to a 6-month high last week.
Share this:
View the latest commitment of traders reports
View the latest commitment of traders reports
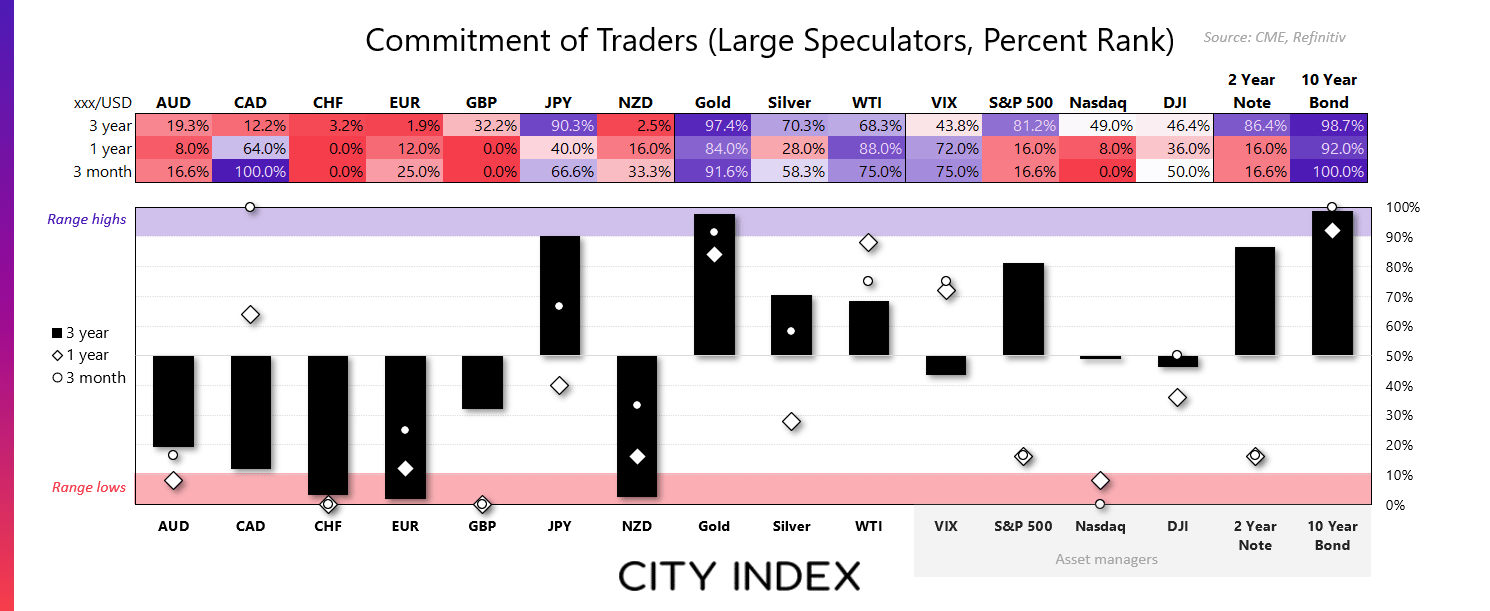
Market positioning from the COT report – 28 January 2025:
- Net-short exposure to VIX futures reached a 6-month high among large speculators
- Asset managers continued to increase their gross-short exposure against Nasdaq 100 futures
- Traders were net-long USD by US $34.3 billion last week, according to IMM (International Money Market), down -0.15 billion from the week prior
- Large speculators increased their net-short exposure to GBP/USD futures by 13.4k, its most bearish level in 38 weeks
- However, much of the change was due to longs being reduced by -21.6% (-16.4k contracts), and short bets were also a touch lor by -3.5% (-2.9k contracts)
- They also reduced net-short exposure to JPY futures by -13.7k contracts, making them net-short by a mere -959 contracts
- Gross-longs on CHF futures were reduced by -23.4% (-1.5k contracts) which pushed net-short exposure higher by 1.1k contracts
- Outside GBP and JPY futures, only minor adjustments were made to forex positioning among FX majors
- There was a slight decrease of net-long exposure to gold, with shorts rising by 6.7% (2.4k contracts) to the 0.3% increase of longs (1k contracts)



VIX (volatility index) positioning – COT report:
Large speculators were seemingly confident of a record high for the S&P 500 looking at how they were positioned on the VIX futures market last week. Net-long exposure was increased to a 26-week high, with gross-longs rising at their fastest weekly pace in 7 months by 19.4k contracts. So I imagine some bullish fingers have been burned, given the gaps lower seen on Wall Street indices at this week’s open, thanks to Trump’s tariffs on Canada, Mexico and China.
With shorts rising and headline risks to linger, we could find that shorts continue to cover this week and net-short exposure diminish. Asset managers may also increase their net-long exposure, who flipped to the bullish side two weeks ago.
Wall Street indices (S&P 500, Dow Jones, Nasdaq 100) positioning – COT report:
Net-long exposure to Nasdaq futures topped in February 2024 among asset managers, and in recent weeks we’ve seen short bets against the Nasdaq trending higher. The 9.7k short contracts added last week was also the highest weekly increase in one year.
Yet they increased their gross-long exposure to S&P 500 futures last week by 1.1 million contracts, (their fastest weekly increase in 11 weeks) while reducing shorts by -170.4k contracts. I imagine some fingers were also burned here at this weeks’ open, given they still remain heavily net long compared to their Nasdaq exposure.
GBP/USD (British pound futures) positioning – COT report:
It’s been 13 weeks since GBP/USD broke beneath its 200-day SMA, and 8 weeks since it respected the key average perfectly before rolling over once more. Yet large speculators have only been net-short GBP/USD futures for two weeks, which hardly screams sentiment extreme from this set of traders.
Asset managers were actually net-short by late October, which means they flipped to the bearish side ahead of the break of the 200-day SMA. And even with a net-short exposure at a 38-week high, there are also not at a sentiment extreme.
Take note that while net-short exposure increased for both sets of traders, we actually saw a reduction of longs and shorts. And that takes some wind out of bearish sales.
A 25bp cut has been fully priced for Thursday’s BOE meeting, so they may need to signal further cuts to revive some of those bearish bets and send the British pound to a new cycle low.
WTI crude oil (CL) positioning – COT report:
The 4-week rally on WTI crude oil finished with a shooting star week, which reversed a few ticks above the $80 handle. We have now seen two weeks of selling as part of a countertrend move, and there could be further downside if President Trump gets his way with lower oil prices from Saudi Arabia.
Yet we’re not seeing a notable rise of short bets against WTI crude oil. Instead, long bets were reduced among managed funds and large speculators for a second week, which saw a drop in ‘speculative volumes’. So with longs covering while shorts remain sidelined, bulls may want to wait for evidence of a swing low to form to seek a dip in anticipation of another leg higher.
How to trade with City Index
You can easily trade with City Index by using these four easy steps:
- Open an account, or log in if you’re already a customer
• Open an account in the UK
• Open an account in Australia
• Open an account in Singapore
- Search for the company you want to trade in our award-winning platform
- Choose your position and size, and your stop and limit levels
- Place the trade


The complete CFD trading experience
Award-winning platforms, competitive spreads, low commissions and dedicated support.
We live and breathe the markets and are dedicated to helping traders realise their ambitions as we continue to set the industry bar.
Economic calendar
Web Trader platform
Our sophisticated web-based platform is packed with features.
Related articles

USD/CAD shooting star puts September surge on notice
USD/CAD has printed a clear bearish reversal pattern after an extraordinary September surge, but confirmation may depend heavily on how US Treasury yields react to Friday’s payrolls report.


USD/MXN Analysis: Is Super Peso Starting to Fade?
Over recent trading sessions, the Mexican peso has continued to show signs of weakness against the U.S. dollar. This can already be seen in USD/MXN, which has gained more than 1.7% over the last three sessions, highlighting sustained buying pressure in favor of the dollar in the short term.


Canadian Dollar Analysis: USD/CAD Returns to July Highs Ahead of NFP
The Canadian dollar continues to face one of its most challenging environments in recent months when it comes to maintaining strength against the U.S. dollar. The weakness of the Canadian currency is clearly reflected in USD/CAD, which has now recorded nine consecutive bullish sessions and gained more than 1.7% during that period.
StoneX Europe Ltd may make third party material available on this website which may contain information included but not limited to the conditions of financial markets. The material is for information purposes only and does not contain, and should not be construed as containing, investment advice and/or investment recommendation and/or an investment research and/or an offer of or solicitation for any transactions in financial instruments; any decision to enter into a specific transaction shall be made by the client following an assessment by him/her of their situation.
StoneX Europe Ltd makes no representation or warranty and assumes no liability as to the accuracy or completeness of the information provided, nor any loss arising from any investment based on a recommendation, forecast or other information supplied. You should always seek independent advice as to your suitability to speculate in any related markets and your ability to assume the associated risks, if you are at all unsure. We are not under any obligation to update any such material. Any opinion made may be personal to the author and may not reflect the opinion of StoneX Europe Ltd.