
Euro Forecast
The Euro remains as one of the stronger currencies in the FX market and that’s on display best in EUR/JPY, where a strong Euro and weak Japanese Yen have combined to drive the pair to fresh all-time-highs, with the pair stalling just before its first ever test of the 180 psychological level.

While most global central banks would probably like to see some element of currency weakness at the moment, the fact that the Bank of Japan is in a position where it’s difficult to hike rates and the European Central Bank has already cut rates quite a bit, there’s been a defined fundamental bias on the long side of the pair that can remain attractive as we move into next week.
I’ve been focusing on the long side of the pair and on EUR/JPY specifically as a way to work with Japanese Yen weakness that does not involve the US Dollar, because if we look at USD/JPY, we can see a bullish backdrop since the 140.00 support hold in April and even as DXY set fresh lows on day one of Q3 or on the Fed’s rate cut on September 17th, USD/JPY has continued into higher-lows. The major pair had its first test of the 155.00 handle in nine months last week, and that makes the prospect of chasing USD/JPY a bit more daunting, although I don’t expect 155.00 to bring on the intervention order from the Japanese Finance Ministry.
EUR/USD
In the major pair of EUR/USD, I’m still considering it as one of the more attractive venues for USD-weakness, as I had looked at in the Tuesday webinar. Bulls took a step forward this week in pushing a breakout from a falling wedge pattern to continue a series of higher-highs and lows that started after a failed run from bears at a really big level.
A week earlier, EUR/USD was trading below the 1.1500 level and I warned then that a clean break of a major psychological level like that was not something that I was expecting. That led to a pullback to a Fibonacci level by the end of that week, and that Fibonacci level at 1.1593 remains a big spot for the pair as it’s now higher-low support potential after functioning as prior resistance.
EUR/USD Four-Hour Chart
Chart prepared by James Stanley; data derived from Tradingview
EUR/USD Daily
From the daily chart we can see that bulls aren’t exactly home free here, and this echoes the broader DXY backdrop where the Dollar set a fresh four-month-high two weeks ago and has been in pull back since. But – price in DXY held a big spot of support at the Fibonacci level of 98.98, and in EUR/USD, there’s still a claim for bearish structure on the daily chart.
This puts emphasis on a couple of key levels. First, it’s the swing high at 1.1668, which held two highs on the daily before sellers pushed down for a fresh low. And then it’s the Fibonacci level at 1.1686, which held the daily high on October 17th before the bearish trend got back in order.
If bulls can pose a break above those levels, particularly with a closed daily bar, it’s going to look more attractive for bullish potential in the pair – and for traders looking to work with USD-weakness, I still think this is one of the more attractive backdrops for such.
Above 1.1686 is the 1.1717 level followed by 1.1748, which was support-turned-resistance in September and early-October, just as the pair started to turn.
EUR/USD Daily Chart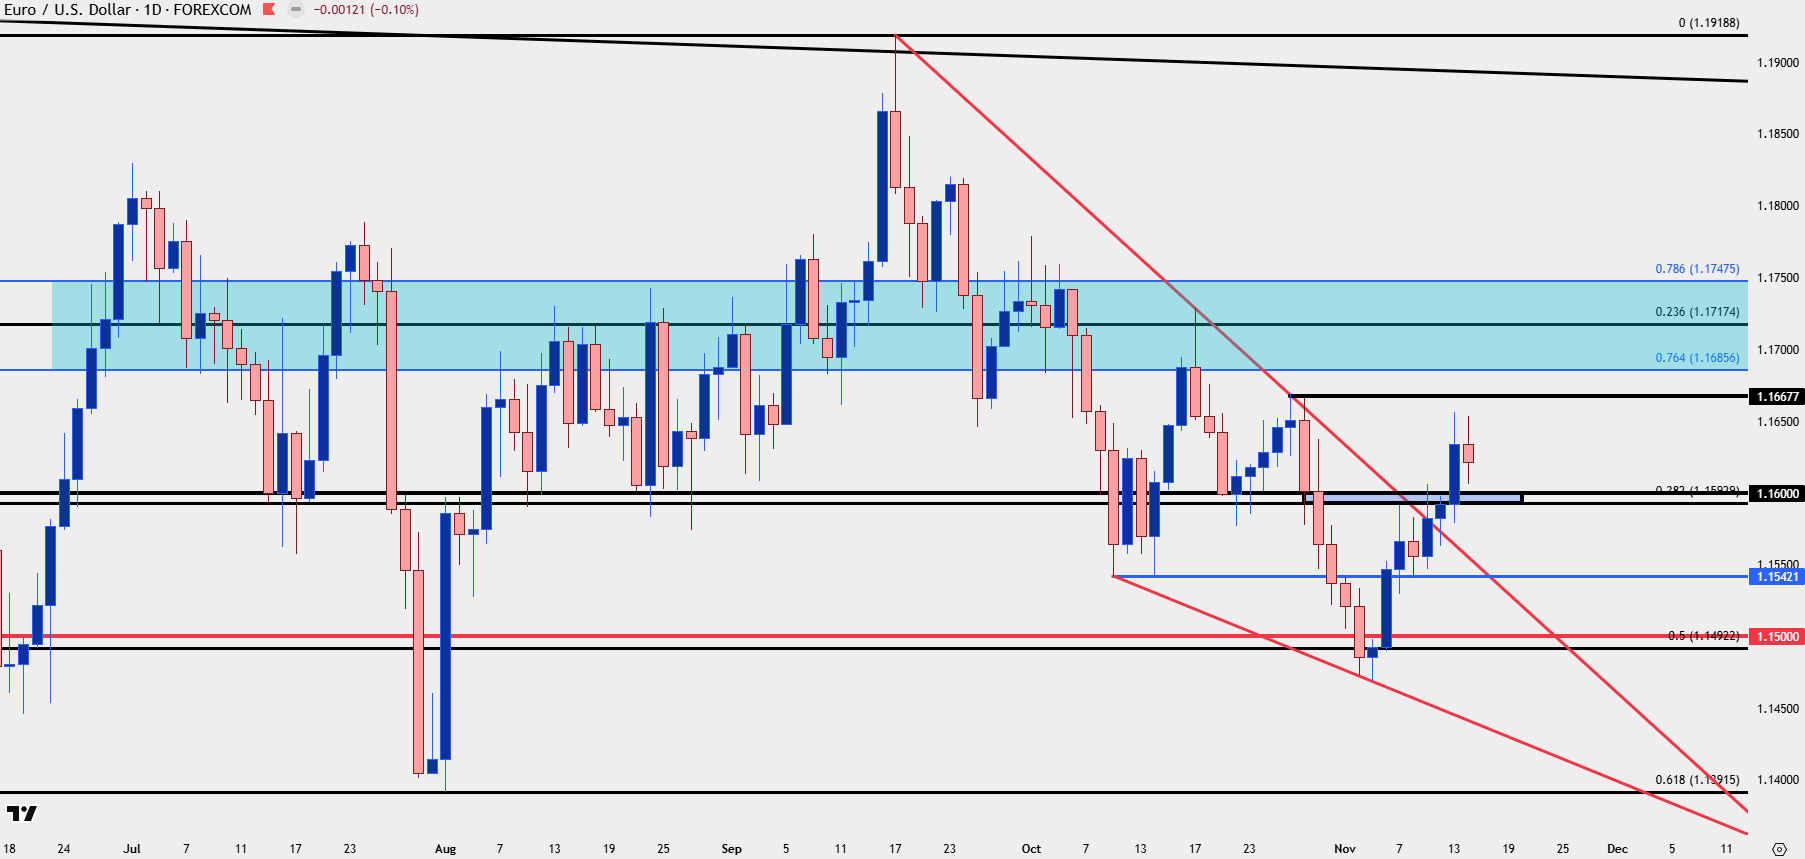
Chart prepared by James Stanley; data derived from Tradingview
EUR/JPY
I talk a lot about the Japanese Yen and it’s been an interesting year for the currency, both from a technical and fundamental point of view. USD/JPY was hit hard when recession fears were taking over in the US and that pushed USD/JPY down for another test of the 140.00 handle in April.
But – since then – USD/JPY has been showing higher-highs and lows and this made the pair as one of the more attractive majors to work with USD-strength, so that when we did have episodes like the early-October breakout in DXY, USD/JPY showed that quite well. And as a case in point, USD/JPY has recently set fresh nine-month highs.
However – I talk about this often in videos where that JPY-weakness can be sought out elsewhere, such as against the Euro. And the below chart illustrates that well, with EUR/JPY in red and USD/JPY in blue, highlighting the outperformance in EUR/JPY since that April swing low.
EUR/JPY (red) v/s USD/JPY (blue) – Daily Chart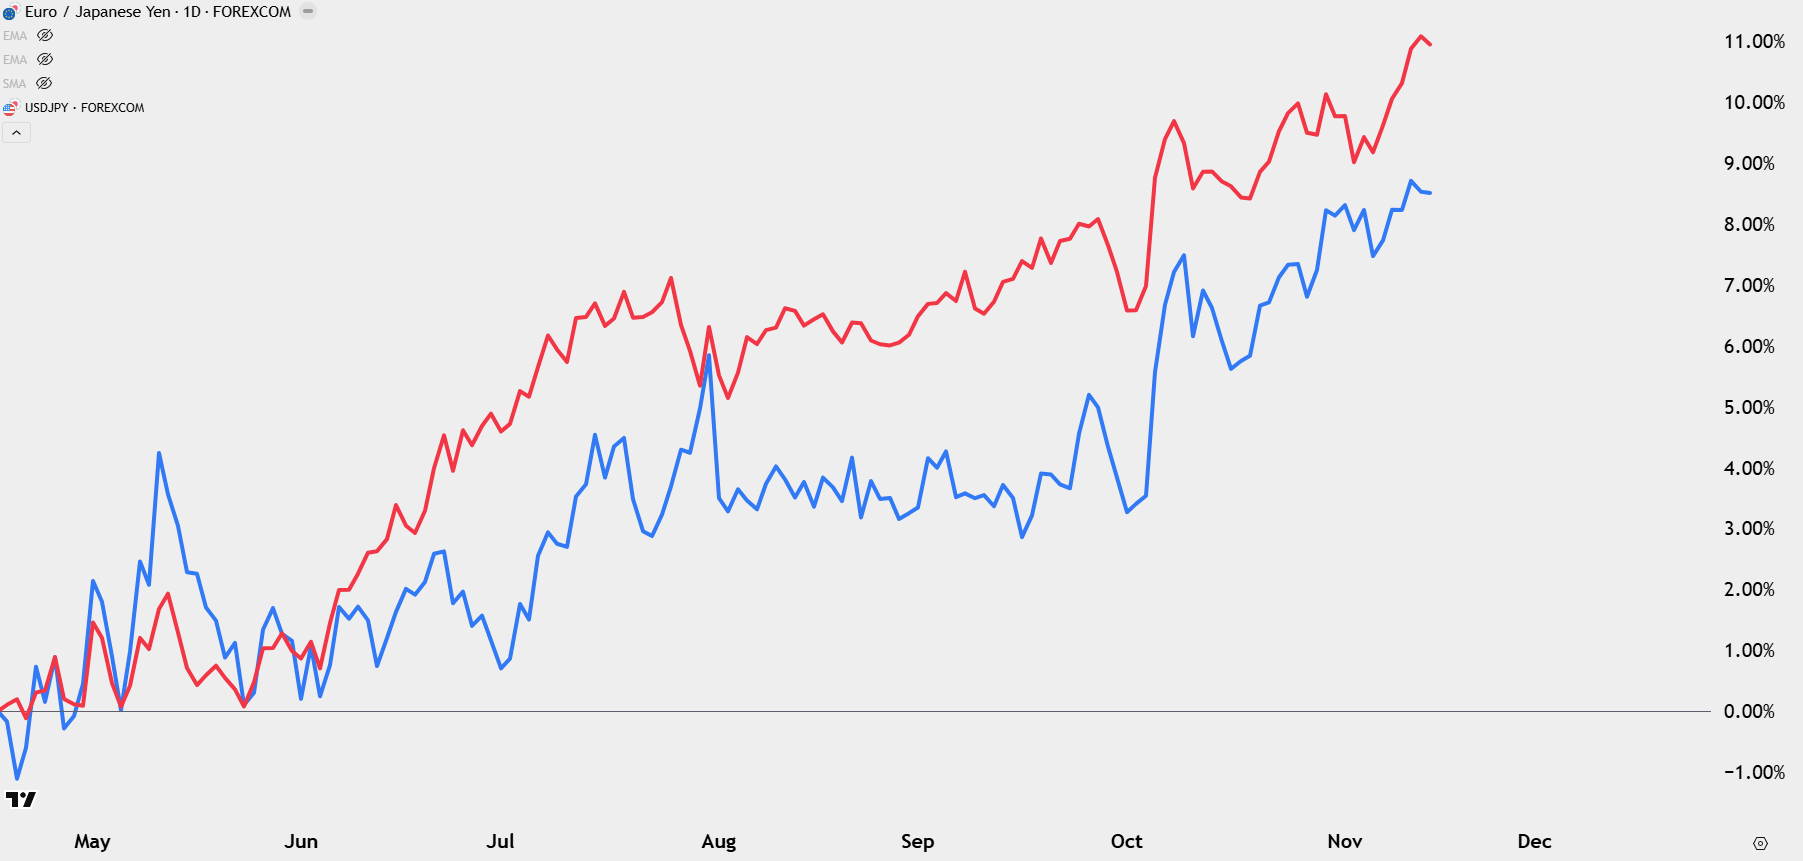
Chart prepared by James Stanley; data derived from Tradingview
USD/JPY v/s EUR/JPY
Perhaps more to the point, when we get to a price level where the finance ministry begins to fear ‘one sided currency movements,’ it’s often the major pair of USD/JPY that they’re focusing on. And this week saw the USD/JPY pair hit the 155.00 level for the first time in nine months.
As I talked about in the Friday video, I’m not expecting that price to necessarily be a show-stopper although we are at the stage where we can start to hear more threats in anticipation of an eventual 160 test, and that can further make EUR/JPY as a more attractive venue to work with JPY-weakness continuation.
The challenge with EUR/JPY right now can be dialed back to psychological levels, and we saw similar scenarios with both 170 and 175. As prices rallied up to 170, bulls slowed the approach near highs or at resistance until, eventually, the support reaction was able to prod a breakout.
Perhaps the more attractive setup, however, was the pullback and show of support at that level a month later (blue boxes, below). And then when 175.00 came into the mix, a harsh resistance reaction showed and, again, it was the re-test of that level as support that was probably the more attractive setup.
Now, we have the 180.00 level in the mix and this can be a logical place for bulls to start to take profits, thereby making for a more difficult backdrop to chase.
EUR/JPY Daily Chart
Chart prepared by James Stanley; data derived from Tradingview
EUR/JPY Shorter-Term Strategy
From a structure standpoint, the past two weeks have been very bullish in the pair with a consistent string of higher-highs and lows. Along the way, there have been a couple of key points that remain as support potential, with the 178.57-178.82 zone as a prior spot of resistance that hasn’t yet been tested for support. Below that, there’s another resistance zone that did show a very quick spot of support when the trend was on the way up, spanning from 177.86-178.07. And then another third zone of support, which I’m considering as an ‘s3’ zone, from 177 up to 177.24. This area had also shown resistance previously but, to date, has only shown a short-term iteration of support.
If we see the 180 level elicit a pullback such as we saw from 175, that third zone remains attractive for bullish continuation purposes.
EUR/JPY Four-Hour Price Chart
Chart prepared by James Stanley; data derived from Tradingview
--- written by James Stanley, Senior Market Analyst, Global Macro