
S&P 500, Nasdaq Talking Points:
- Equities continued to rip through the Q3 open with both SPX and NDX setting fresh all-time-highs.
- For a bigger-picture look at equities we’ve just released Q3 forecasts and I covered equities, remaining bullish and looking for pullbacks as we push into the second-half of the year.

“The time of maximum pessimism is the best time to buy, and the time of maximum optimism is the best time to sell.” That’s a quote from John Templeton and I’ve used that in webinars a couple of times, including in August/September of 2023 as stocks were trying to dig out of support following a pullback. Last quarter showed this well with one of the most epic equity reversals that the world has ever seen.
At the open of Q2 a sell-off had engulfed stocks and it didn’t take long for the pessimism to take-over. A noted wall street personality soon warned of a ‘Black Monday’ type of event; and interestingly that Monday ended up being the low before stocks went on to rally by more than 25% into the end of the quarter – and for the Nasdaq 100 that rally ratcheted up a whopping 37% from the early-April low.
Undoubtably these are difficult moves to work with for traders, perhaps even more so than range bound, digested backdrops; but perhaps the most attractive element of such a scenario is the bias that’s been displayed and the prospect of that continuing.
Much as I’ve written in quarterly forecasts for the past two years-plus, the attraction is in trends and looking for pullbacks. Not all supports will hold, to be sure, and this means that some stops may get hit along the way. But – there will also be situations, such as we had last quarter, where rallies run far beyond what one could’ve initially hoped and this is where (or why) traders can seek out that asymmetry in risk versus reward.
I looked into this in early-Q2, in this very same weekly forecast, highlighting the oversold reading in the S&P 500 that had only shown twice in the pace decade. That was the weekend that we heard of the ‘Black Monday’ warning, and that Monday ended up showing support at a massive spot on the chart to allow for a bounce – which led into the larger bullish reversal.
The S&P is now well into overbought territory on the daily chart and chasing this move via breakouts or fresh highs is a challenge. There is context for pullback, however, and there’s possible support at the 6145 level that had previously helped to set the high back in February. Below that, 6k looms large, and then there’s a major decision point in the zone from 5782-5864. I’m considering that as my ‘s3’ zone of support at the moment and if bulls can’t hold that, then something has likely shifted in the backdrop.
S&P 500 Daily Price Chart
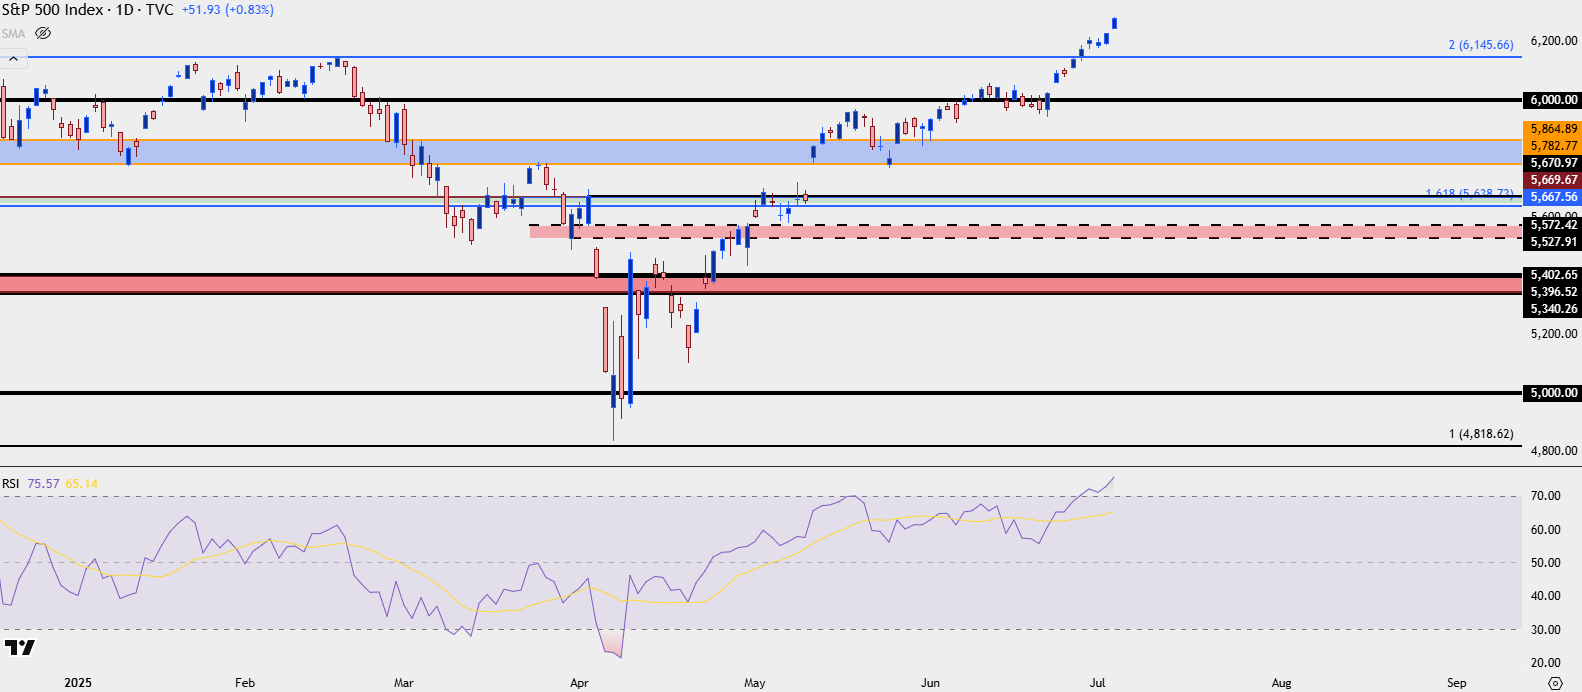
Chart prepared by James Stanley; data derived from Tradingview
Nasdaq 100
The low for NDX in Q2 showed right at my ‘s3’ zone of support from the Q2 forecast. Similar to SPX above, the index is now overbought via RSI on the daily chart, thereby making a challenge for breakout strategies or chasing fresh highs. But – there is context for support. Like SPX, there’s a prior high from February that lines up at a Fibonacci level of interest, and for NDX, that’s at 22,167. Below that, I’m tracking a swing of resistance-turned-support at 21,611, and then there’s a wide zone which I’m considering as a ‘decision point’ running from the 20k level up to 20,673. Failure from bulls to hold that illustrates a shifting backdrop, perhaps due to tariffs, but at that point I think it’s time to reassess near-term strategy.
Nasdaq 100 Daily Chart
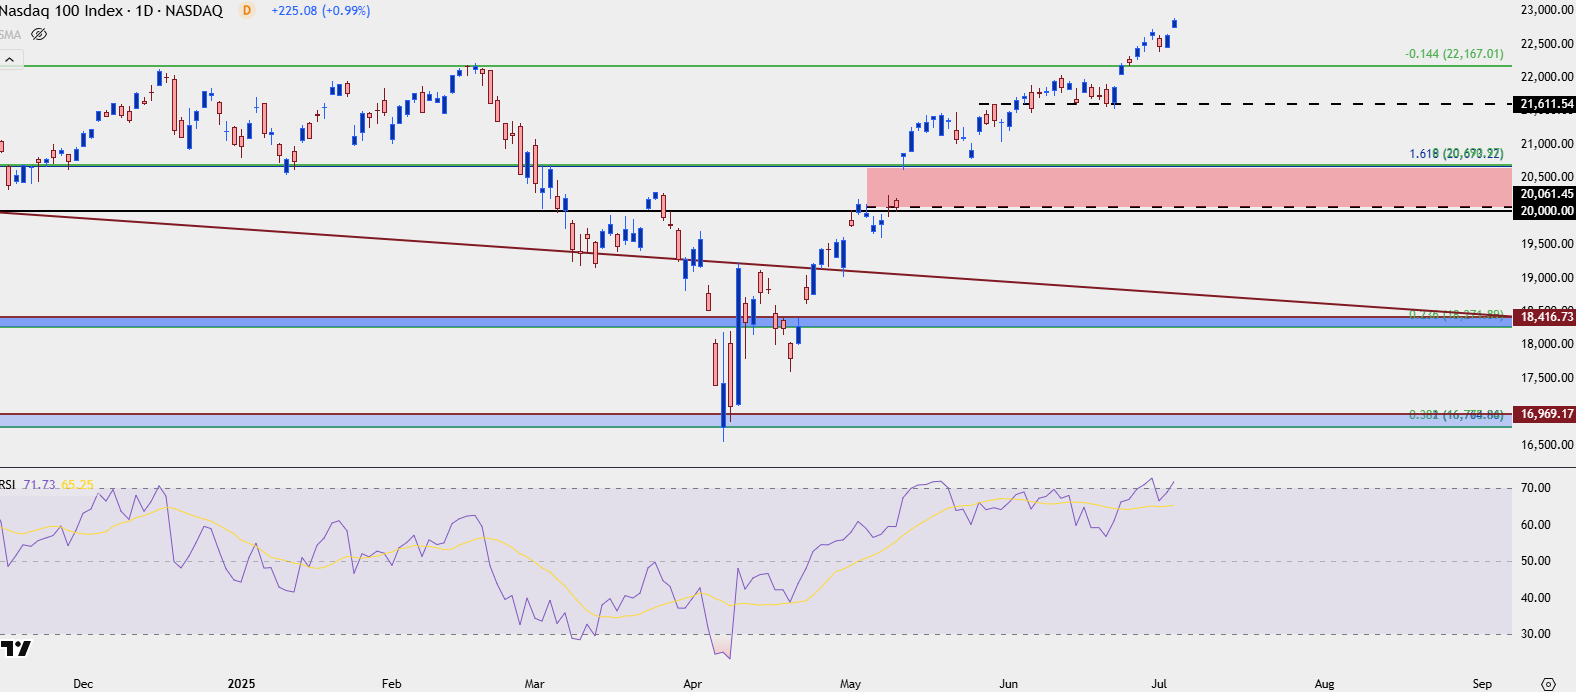
Chart prepared by James Stanley; data derived from Tradingview
--- written by James Stanley, Senior Strategist