
- Hot US inflation fails to sustain Treasury yield surge
- Fed tightening brought forward, barely changed by end-2027
- Treasury futures reversals raise doubts about dollar upside
- AI investment concerns add to USD/JPY carry unwind risks
September's US inflation report gave the big dollar and Treasury yields every excuse to surge to fresh highs on the back of a more hawkish Federal Reserve outlook. Yet despite an initial knee-jerk reaction consistent with the report's hawkish detail, both reversed sharply.
The price action in two and 10-year Treasury note futures suggests the market is attempting to establish a bottom, if it hasn't already. If that's the case, it could have significant implications for the US dollar given the tailwinds it's received from surging Treasury yields earlier this year.
No shortage of hawkish detail in September CPI
September's US inflation report was undeniably hot with headline consumer prices surging 0.6% over the month, accelerating from 0.4% in August. That lifted the annual inflation rate from 3.4% to 3.7%, exceeding the 3.6% expected.
More importantly for the Federal Reserve, core inflation rose 0.3% against expectations for 0.2%, with the unrounded increase coming in at 0.335%, just a smidgen away from rounding up to 0.4%. The annual core rate also accelerated from 2.4% to 2.6%, a tenth above consensus.
The underlying detail did little to soften the hawkish headline message. Shelter inflation accelerated to 0.4%, core goods prices rose 0.3%, while core services increased 0.4%. Supercore inflation, which excludes shelter from core services, rose 0.3%, while the pickup in the inflation diffusion index pointed to price increases becoming more widespread rather than simply reflecting an energy-driven spike.
That's something that may have drawn the attention of Kevin Warsh given he specifically mentioned this measure before signalling a resumption of hikes in his Jackson Hole speech in August.
Any way you sliced or diced it, this was a hawkish report that, under most circumstances, would have encouraged markets to rush to price in far more tightening from the Fed. Yet that's not what happened.
Fed hikes brought forward but little change overall
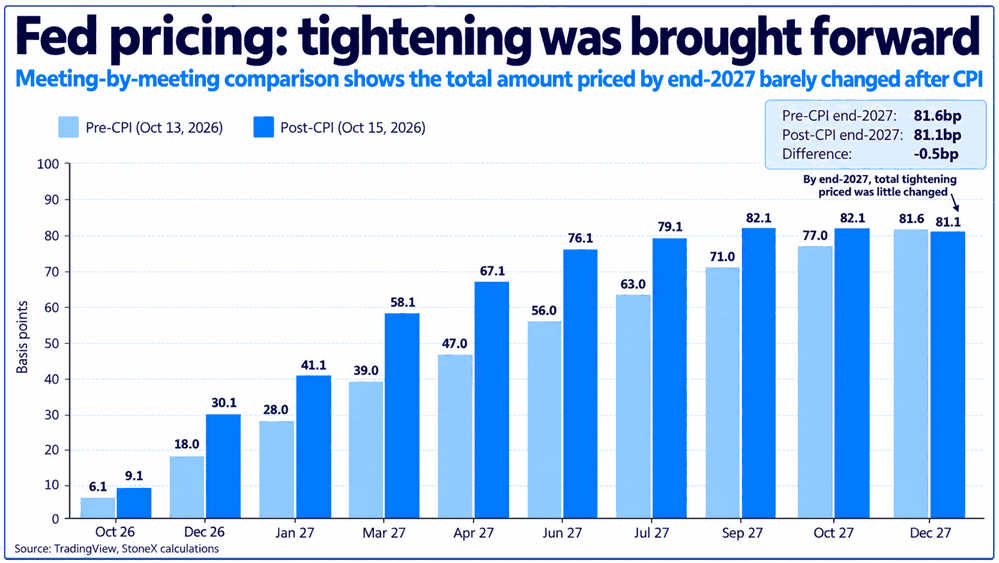
While there was a modest increase in Fed tightening expectations following the inflation report, the changes were concentrated towards earlier meetings, rather than signalling a materially more aggressive tightening cycle.
Source: TradingView
For October, the amount of tightening priced increased from 6.1 to 9.1 basis points, still implying a considerably greater likelihood of the Fed leaving rates unchanged. By December, a full quarter-point hike is fully priced and then some, with around 30 basis points of cumulative tightening expected.
But looking further out, the market effectively brought forward the expected timing of tightening without increasing the overall amount priced. By December 2027, cumulative tightening expectations actually declined marginally following the inflation report.
In other words, despite the very hawkish inflation surprise, the market was unwilling to price a higher terminal policy rate.
Reversal patterns suggest bonds trying to bottom
Source: TradingView
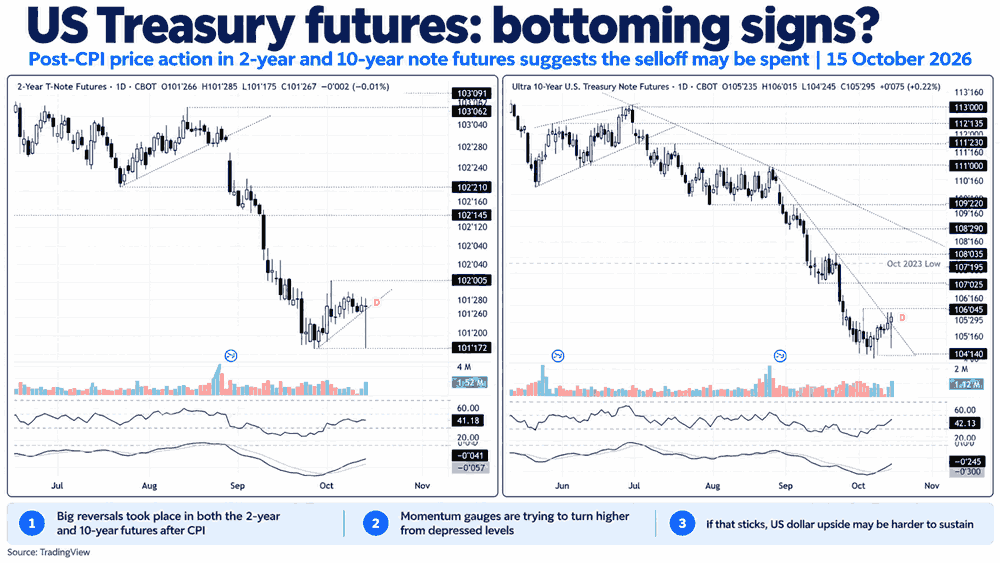
The reluctance of markets to price a more aggressive Fed cycle is reflected in the price action in two-year Treasury note futures, which formed something resembling a dragonfly doji following the inflation report. While the price didn't quite trade through the September lows, it came close before reversing sharply, highlighting just how unwilling traders were to sustain the sell-off.
While the pattern hasn't emerged following a pronounced decline, as would normally be associated with a bullish reversal signal, the scale of the recovery is eye-opening, particularly given the strength of the inflation report.
A similar message came from 10-year Treasury note futures which formed a hammer candle after approaching the recent lows. The price also broke above a minor downtrend extending from the high zone set in early September.
With both reversals driven on decent volumes, the price action suggests Treasury futures may be attempting to establish a bottom, if they haven't already. Given bond prices move inversely to yields, that could have significant implications for the big dollar considering the strong positive correlation it's maintained with US Treasury yields for extended periods this year.
US Dollar upside momentum starts to fade
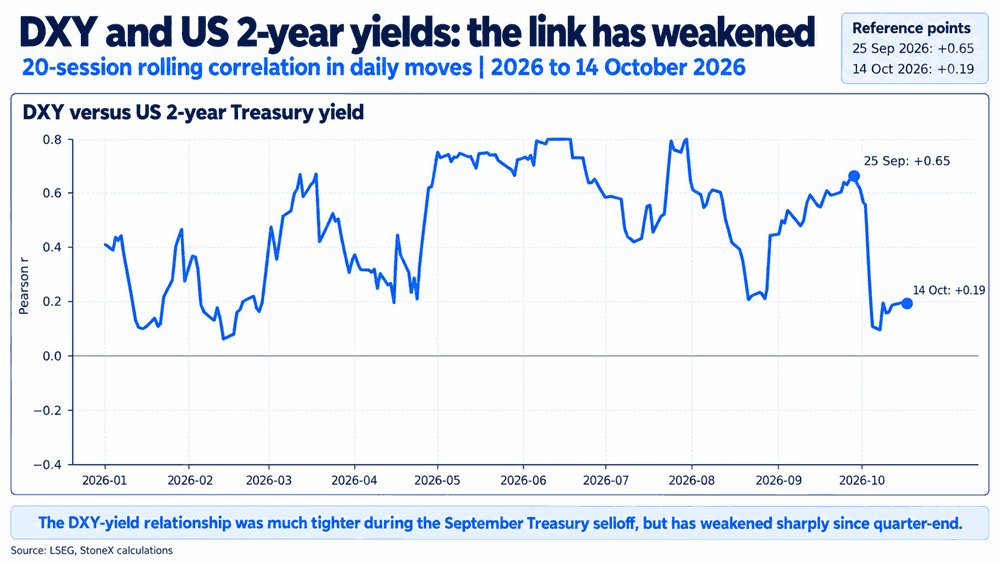
That relationship is evident in the rolling correlation between daily movements in the US Dollar Index and changes in two-year Treasury yields, which strengthened during September's bond-market sell-off before weakening sharply around the quarter turn.
Source: LSEG
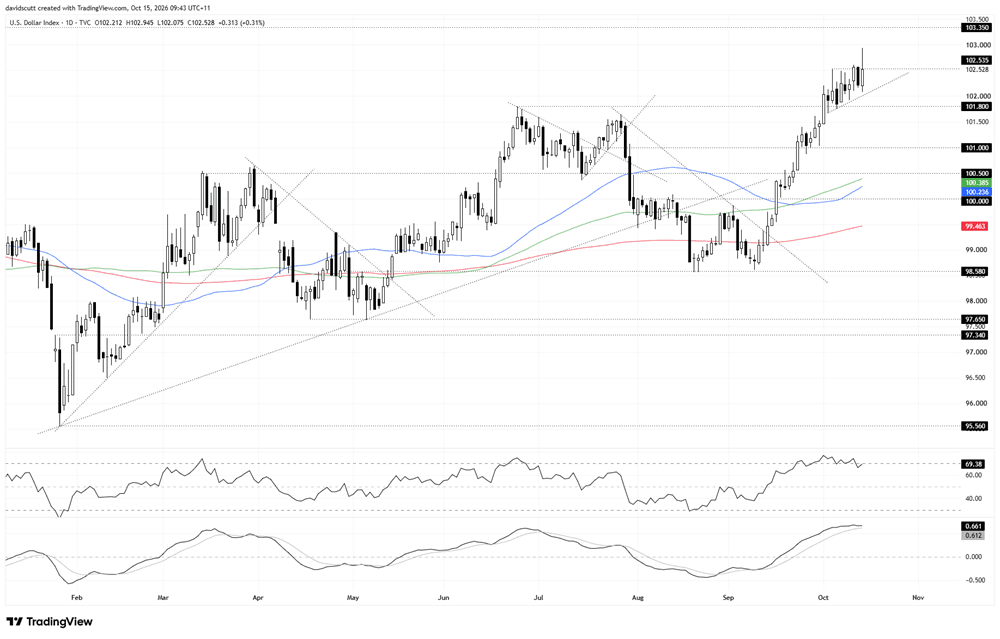
The loss of upside momentum is also evident in the US Dollar Index which surged to fresh highs following the inflation report, coming within a whisker of 103 before being slammed back lower towards the close.
While the DXY remains above its key medium and long term moving averages there are signs of exhaustion emerging. Bearish divergence has developed between the price and RSI (14), while MACD is starting to roll over, approaching a potential bearish crossover with its signal line.
Source: TradingView
The inability to sustain the rally is telling given the strength of the inflation report, which under normal circumstances could have provided fresh fuel for further dollar upside.
USD/JPY downside risks starting to build
Source: TradingView
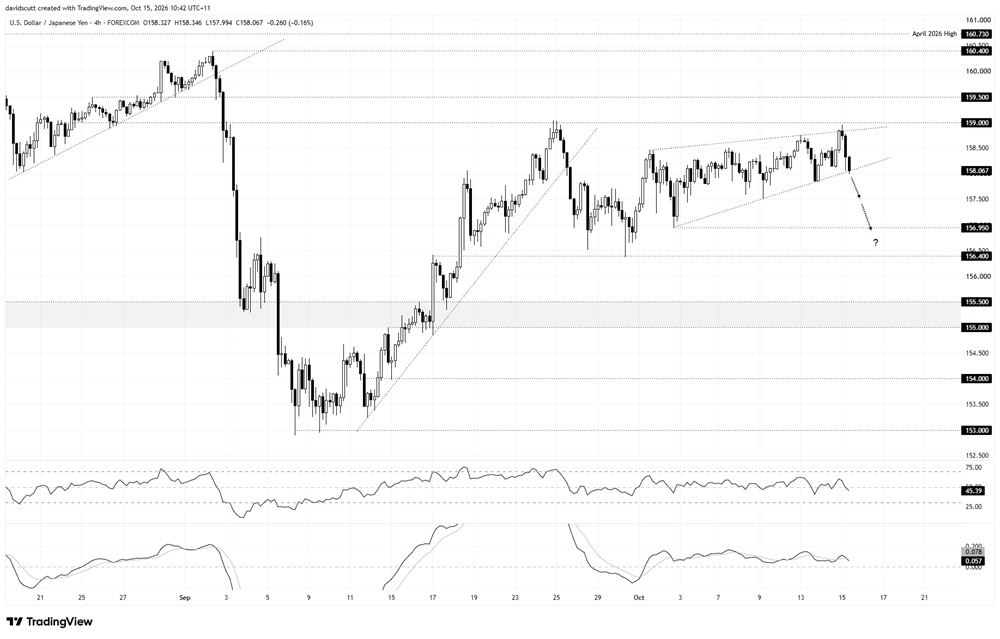
Despite the substantial increase in US Treasury yields seen over the past couple of months, USD/JPY remains well below 160, a testament to the intervention threat hanging over the market from Japan's Ministry of Finance and the US Treasury. Without that threat, the scale of the move in US yields could arguably have pushed the price beyond the high seen earlier this year.
Looking at the four-hourly chart above, USD/JPY has been trading in something resembling a rising wedge since the October 2 low of 156.95. The price has been banging between two important daily moving averages, with the 200-day at 158.57 providing resistance and the 50-day at 157.74 sitting immediately below where the pair now trades.
Even with the hawkish inflation report, the price action over the past half a session feels distinctly heavy, with a three-candle evening star forming just beneath 159, a resistance level that stalled rallies earlier this year. The price is now testing the lower trend line of the rising wedge around 158, an area that has attracted buying interest on several occasions over recent weeks.
A sustained break below the wedge would put 157 in focus, where buyers stepped in twice early this month, followed by 156.95 and 156.40. Beyond those levels, there's a more substantial support zone running between 155.50 and 155.
Could cracks in the AI trade trigger a broader unwind?
Coinciding with the reversal in US Treasury yields and dollar on Wednesday, there was renewed volatility in tech stocks, raising the possibility that the move in bonds, at least, was partly driven by safe-haven flows.
If doubts about the sustainability of AI capital expenditure continue to grow, there's a risk that investment plans could be scaled back, particularly in the US where much of the infrastructure buildout is concentrated. That could weigh on expectations for nominal economic growth and, in turn, the amount of tightening the Fed may ultimately need to deliver.
It's not my base case, but if those concerns develop into something more significant and trigger forced selling in some of the AI names that have surged over recent years, there's also the risk of a broader unwind in yen-funded carry trades, adding another potential source of downside pressure on USD/JPY.