
U.S. Dollar Summary
The past week brought some key drivers to the fray but the big week for the U.S. Dollar is ahead, as there’s the FOMC rate decision ahead of the Non-farm Payrolls report. But, perhaps even more important for the upcoming week is a factor that’s recently gotten a lot of attention with the U.S. Treasury’s Quarterly Refunding Announcement, or QRA. The U.S. Dollar has spent the past week holding resistance at the 200-day moving average and I look at the Greenback from a couple of different vantage points below.
This image will only appear on forex websites!

U.S. Treasuries showed considerable volatility last year and this brought large repercussions across global markets. The 10-year tagged the 5% marker in early-October and that’s a massive move from the 3.25% that was in as the lows just six months prior. And after that 5% mark was hit, a strong sell-off developed that saw the 10-year yield plunge below 4% by the end of the year.
When that 5% level was hit on the 10-year, stocks looked to be in a poor spot. The U.S. Dollar had just ripped-higher for 11 consecutive weeks, and there was legitimate fear that the Fed may be forced to hike again as inflation remained stubbornly high. But it was in that month of October that matters began to calm and by the time we got to the November 1st FOMC rate decision, the stage was set for reversals in both the U.S. Dollar and U.S. equities, both of which were helped along by a rather dramatic drop in 10-year Treasury yields.
U.S. 10-Year Treasury Note Yields – Weekly Chart (indicative)
 Chart prepared by James Stanley; data derived from Tradingview
S&P 500 futures have gained as much as 18.24% from those October lows; and Nasdaq 100 futures have gained as much as a whopping 24.03% in around three months – helped along by the continued softening of yields as rate cuts have gotten priced-in for 2024.
But perhaps lost in the shuffle is an item that’s getting more and more attention, and that points back to U.S. Treasury Secretary, Janet Yellen. One of the reasons that yields spiked last year was the Treasury’s plan to auction off a considerable amount of long-term debt. That additional supply was thought to sink prices, which would drive yields higher, and that’s precisely what was showing from July through October as both yields and the USD rose to fresh highs.
But it was around late-October that this began to shift when the Treasury department updated the Quarterly Refunding Agreement, but this time they were going to offer more short-term debt and that helped to pare back some of the fear that had shown around surging long-term yields. That helped to bring bulls back into stocks, which drove into the ‘Santa Rally’ at the end of the year, and it helped to bring bears back to the U.S. Dollar as DXY snapped back.
We get the next installment of the Quarterly Refunding Agreement on Wednesday, with the Treasury department scheduling a webcast for just a couple of hours ahead of the Fed. This is available from the Treasury department’s website, and this is an open presentation that can be set up from the link below:
U.S. Department of Treasury Quarterly Refunding Webcasts
U.S. Dollar
The U.S. Dollar is going to be hit by both fiscal and monetary policy next week, Wednesday specifically, as the QRA takes place just a couple of hours ahead of the FOMC rate decision. But the week doesn’t end there as there’s also the Non-farm Payrolls report scheduled for Friday.
For the past week there was an encouraging item for equity bulls and USD-bears as taken from the Friday inflation report. The U.S. Core PCE indicator came in at 2.9% which marks the lowest reading since the release in April of 2021, on top of the fact that the ‘Fed’s preferred inflation gauge’ is now carrying a 2-handle.
Bears couldn’t get much run, however, as the USD remained pegged to the 200-day moving average that’s been in-play for almost two weeks. There was continued churn around that level, and the same can be said about EUR/USD with its own 200DMA; but USD bulls had an open door on Tuesday and failed to drive through, while USD bears had an open door on Wednesday and also failed to drive. This suggests that the market is waiting for a bigger driver and given that outlay for next week, Wednesday would appear to be the date circled on the calendar for an influx of volatility.
U.S. Dollar Daily Price Chart (indicative)
 Chart prepared by James Stanley; data derived from Tradingview
USD into FOMC
Given the backdrop it would seem that USD bears had plenty to work with this week, yet they weren’t able to drive the currency to fresh lows. This is a factor of consideration as we move into next week and perhaps one of the more interesting aspects is dynamics around the Euro. Christine Lagarde at the ECB again kicked the can on the topic of rate cuts and that’s something that’s tended to keep the Euro as relatively strong against the U.S. Dollar, as Powell has been a bit clearer that the conversation around cuts has already begun at the Fed.
And with the Friday inflation report showing even more progress, with a below-expectation print inside of 3%, it would seem as though USD-bears would have another reason to celebrate, and that’s not showing at all as of this writing as DXY has gained since the report earlier this morning.
While it could be simple to look at the Fed’s projections and the Treasury’s plan for hitting short-term debt supply this year as USD-negative, one must consider that the U.S. Dollar is just a composite of underlying currencies, and it’s heavily weighted against the Euro with a 57.6% clip. I had explained this in the article about the USD published earlier this week and this further illustrates how if the U.S. Dollar is going to trend, it’s likely going to need at least some participation from other currencies that make up the DXY basket.
I’ll dig deeper into the two largest components of that basket below with EUR/USD and USD/JPY.
In the U.S. Dollar’s shorter-term setup, price has been range-bound and that range has been consistent of late. There are supports at 103.10, 102.78 and then 102.55. If those get broken, the next major spot would be a zone around the 102.15 level. Above current price, the 103.82-103.87 area would be the first major zone to encounter, and if bulls can push through that then there are shorter-term resistance levels at 104.03 and then 104.21.
U.S. Dollar Four-Hour Chart (indicative)
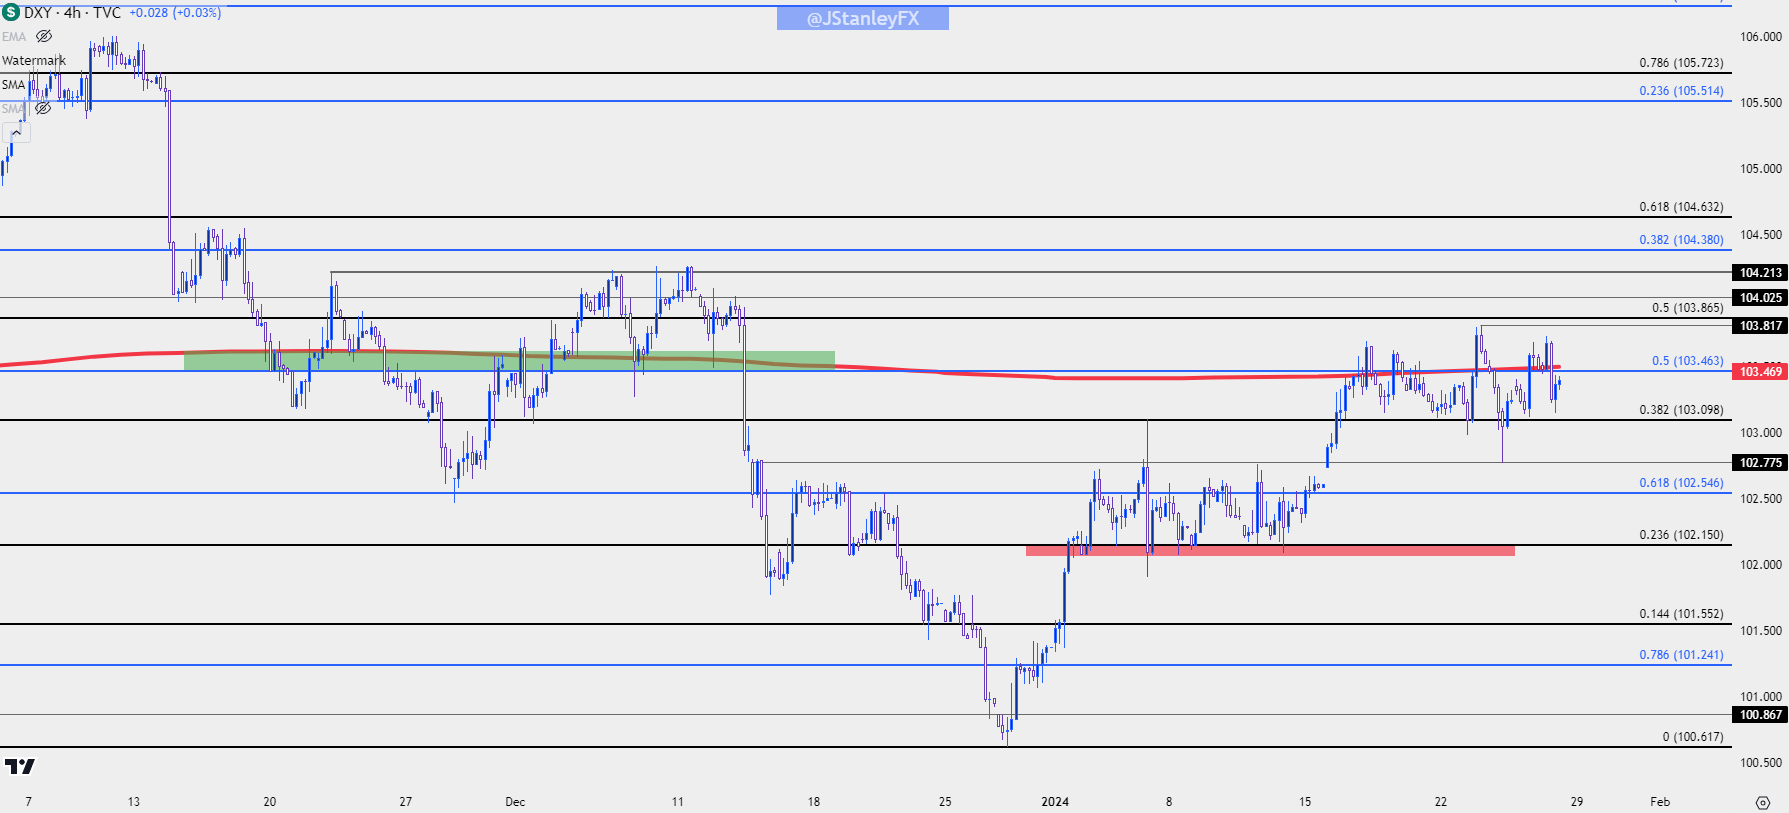 Chart prepared by James Stanley; data derived from Tradingview
EUR/USD
Earlier in the week there were a couple of PMI releases that highlight a quandary, and I had looked at this in the webinar on Wednesday: The preliminary read of the HCOB Eurozone PMI print on Monday came in below forecasts, printing at 47.9 against an expectation of 48.0. Readings below 50 indicate contraction while reads above highlight expansion.
Later that morning, the preliminary read of the U.S. Services PMI release came out at 52.9, well beyond the 51.0 that was expected and well into expansionary territory.
Yet, at this point, the wide expectation appears to remain that the Fed will cut rates before the European Central Bank.
This of course was a major push point in the second-half of last year. As the U.S. Dollar was surging from July into October, the Euro was getting hit from multiple angles. Former ECB President Mario Draghi came out to say that he would be surprised if the Eurozone didn’t move into recession in the near-term.
But as U.S. yields started to fall in late-October, EUR/USD began to rally along with risk assets and, to this date, more than half of that trend remains. There was a big shot-in-the-arm in December, with the Fed meeting on December 13th followed by an ECB meeting a day later. Powell shared that the conversation around rate cuts had begun, helping to sink the USD and buoy the Euro. And then a day later Lagarde said that the ECB hadn’t yet begun to plan for rate cuts, which helped to extend those trends.
So while there appears to be little scope for a hawkish Powell next week, the major question here is market reaction. Narrative often follows price and while the Fed will get considerable attention, the QRA will also be a factor.
In EUR/USD, price has held support at the 200-day moving average for the past week and change. That stall at support has allowed for the build of a falling wedge, which is often approached with aim of bullish reversals. Below current support is another massive area, and this was the spot that was in-play ahead of the the December FOMC/ECB meetings, which plots from 1.0750-1.0766.
If bears can take control, the next major support zone on my chart runs from 1.0611-1.0638, and there’s a swing at 1.0673. On the top side of the pair resistance is a bit clearer and these are the same levels looked at on webinars over the past two weeks. If bulls can force the break of the wedge, the first major zone runs between Fibonacci levels at 1.0943 and 1.0960, and if they can stretch beyond that, a 3rd test of the 1.1000 level could soon come into play.
This image will only appear on forex websites!

EUR/USD Daily Price Chart
 Chart prepared by James Stanley, EUR/USD on Tradingview
USD/JPY
There was a Bank of Japan meeting earlier in the week, but the response in the Yen appeared to have a delayed reaction as it wasn’t until a day later that JPY showed volatility. USD/JPY showed an aggressive snap back move but caught support at a Fibonacci level, plotted at 146.66. That has since led to a bounce and there’s a pretty clear area of overhead resistance at 148.42, which had held for multiple days before the Wednesday pullback appeared.
I remain of the mind that this can function as a USD-with amplification, largely as driven by the carry or carry-unwind themes. When there’s fear of a deeper sell-off or bearish move in the USD, there could be even greater fear in USD/JPY as there’s not only the falling USD to contend with, but also stronger-JPY as carry trades unwind. This is what hit the pair in Q4 over the past couple of years.
If the net result from next week is USD-strength, and USD/JPY rallies, there’s a major spot sitting overhead that could soon become problematic. That’s the 150 psychological level that’s been a part of the pair’s reversal/pullback moves over the past two years. If USD/JPY does rally above that price, we may hear grumblings from the Japanese Finance Ministry again. The carry on the long side remains positive so if there’s lessened fear of a breakdown in the USD, that 150 test could happen quickly.
But, if we do see Powell punch the U.S. Dollar lower again next week, then the short side of USD/JPY can fast become attractive on that prospect of carry unwind.
USD/JPY Daily Price Chart
 Chart prepared by James Stanley, USD/JPY on Tradingview
Gold (XAU/USD)
Gold showed intense volatility in Q4 as the rates theme was taking on more importance, and this market perhaps illustrates that theme around yields even more cleanly than many FX-pairs.
Coming into the month of October, as the 10-year was pushing up to the 5% marker, gold prices were getting crushed. Ahead of the NFP report released in the first week of October, gold prices had moved to an extreme oversold reading with RSI closing below the 20-level on the daily chart. That’s pretty rare as it’s only happened a handful of times in the past 20+ years and it didn’t take long for the market mood to shift.
A strong move developed in October with price pushing back to the psychological $2k level, which held as resistance. The pullback then ran into mid-November, with support showing up at the 200-day moving average and that led-in to the CPI report on November 14th. That led to a massive extension in the trend with gold spiking up to a fresh all-time-high a couple of weeks later. But, the familiar resistance that’s held for the past three years kept bulls in-check and prices pulled back until they got another shot-in-the-arm at the December FOMC rate decision.
That bounce has since led to a lower-high and from that inflection point a falling wedge has formed. Notably, bears haven’t yet been able to test below the $2k level so far in 2024 trade, so this would be another item that could be of interest in the event of USD-weakness around next week’s outlay. If bulls can force a break, they still have to deal with the $2,050-2,082 zone that’s proven stubborn so far.
This image will only appear on forex websites!

Gold (XAU/USD) Daily Price Chart
 Chart prepared by James Stanley, Gold on Tradingview
--- written by James Stanley, Senior Strategist