




S&P 500 Forecast: SPX Levels After 6500 Resistance
It’s been a strong year for SPX with a strong reversal from the March and April sell-offs. The question now is how much more fuel do bulls have left in the tank as we near the Fed’s expected rate cut in two weeks.
Share this:

S&P 500, SPX Talking Points:
- Stocks have held strong since the reversal in April.
- While FOMC rate cuts have been a bullish factor for equities the question now is just how dovish the Fed might be at their meeting in two week. Markets are currently pricing in another 100 basis points of cuts to the end of next year, setting the bar fairly high.
While the year started with a lot of enthusiasm for stocks, that quickly turned in February and March. Initially, it was fear over tariffs and then as data began to stack that recessionary tendencies may be showing in the world’s largest national economy, fear began to take over.
It was around the Q2 open when matters got really nasty and it didn’t take long before some noted financial pundits were warning of a ‘Black Monday’ like scenario. At the time, the two major forces behind equities seemed disinterested in compromising. President Trump continued to push forward with tariff implementation and the Federal Reserve, who had become a consistent form of support for equities going back to the Financial Collapse, seemed disinterested in cutting rates; instead fearing that tariffs could produce inflation. What they didn’t but probably took a toll was the fact that the Fed’s rate cuts last year didn’t work out too well, as long-term yields shot higher, along with the US Dollar; and inflation jumped and was elevated at the start of the year.
But paradoxically that’s also when stocks started to look fairly attractive. I had identified this as my top trade idea for 2025, looking at the long side of equities but only after a pullback. As written here, SPX showed its first oversold reading on the weekly chart since Covid and that’s been somewhat of a rare occurrence. This is when Trump started to soften on tariff implementation and as he delayed that a couple days later, stocks ripped with a historic daily outing. That has since led into a really strong four-month backdrop and along the way, the Fed has finally softened their tune, as well, even if the data is perhaps not befitting of such a move.
At the July FOMC meeting Jerome Powell spoke to the matter directly, saying that he didn’t think policy was overly restrictive given current inflation levels along with the unemployment rate remaining near ‘full employment’ levels. An NFP report issued a couple days later echoed that unemployment rate at 4.2%, but revision to the headline number for the prior couple of months produced shock, to the degree that President Trump fired the head of the BLS responsible for the report and suddenly rate cut expectations came rushing back.
Jerome Powell’s tune had shifted at his Jackson Hole speech in late-August, and even with Core PCE coming in at 2.9% last week, the Fed appears to be readying for rate cuts which has helped to keep equities as strong.
In SPX, the main quandary at this point is technical in nature as the 6500 level has traded, but bulls haven’t been able to muster much momentum above that price yet. So that remains a significant line-in-the-sand in the near-term.
S&P 500 Weekly Price Chart
Chart prepared by James Stanley; data derived from Tradingview
On the above chart I’ve left a Fibonacci retracement applied to the 2022 pullback and there remains a few interesting items from that annotation.
Interestingly, the February reversal began just after a test of the 100% measured move, plotted at 6145. But since the reversal and breakout to fresh highs, that price hasn’t yet been tested for support – so if we do see a pullback in SPX, that automatically becomes a point of reference, as does the 6k psychological level which also showed some resistance on the way up, albeit not as clean as the Fibonacci extension, but hasn’t yet shown any support since the break.
Also of interest, and something that may not come into play without some sort of surprise factor, is the 161.8% extension of that 2022 pullback, which plots at 5638.
That price set the high last July just before a three-week sell-off. This was around the Japanese Yen carry unwind scenario, with stocks ultimately finding their footing as we got closer to the Fed’s first rate cut from that cycle. That price again was in as short-term support in the sell-off earlier this year but since price broke back-above, there hasn’t been any re-tests yet.
S&P 500 Weekly Price Chart
Chart prepared by James Stanley; data derived from Tradingview
SPX Shorter-Term
While both charts above have some appealing supports, the fact of the matter is that they’re fairly far away and we’ll likely need some form of a bearish catalyst to bring them into play. And as we saw in Q2, markets are often short-term oriented so if we do get that catalyst it might not be far ahead of ‘Black Monday’ calls out of the financial media.
So, in interest of tracking this in a shorter-term format I look at the daily chart below since we’ve had that stalling effect at 6,500. There’s now a short-term rising wedge that’s in-play after yesterday’s gap-down, and while this morning started with a gap up, that overnight gap was quickly filled and yesterday’s close is currently helping to set support for today’s low.
This keeps the door open for a deeper pullback in SPX and this highlights a few more levels and zones of interest. For resistance, there’s the earlier week gap up to 6460, which is then followed by 6500. Underneath recent support is a swing just below 6340, as this was a prior gap that was quickly filled and then came in as support in mid-August. If sellers can grind below that, then there’s some remaining unfilled gap from early-August, which I’m tracking from 6234-6271. If this comes into play it should be a big decision point, as sellers would be staring down the 6146 level that was resistance back in February (and also the Fibonacci extension). I’m linking that price up to a swing-low at 6173 to create a zone of interest for SPX; and if that gets taken out, the above bigger picture scenarios are in-play.
SPX Daily Chart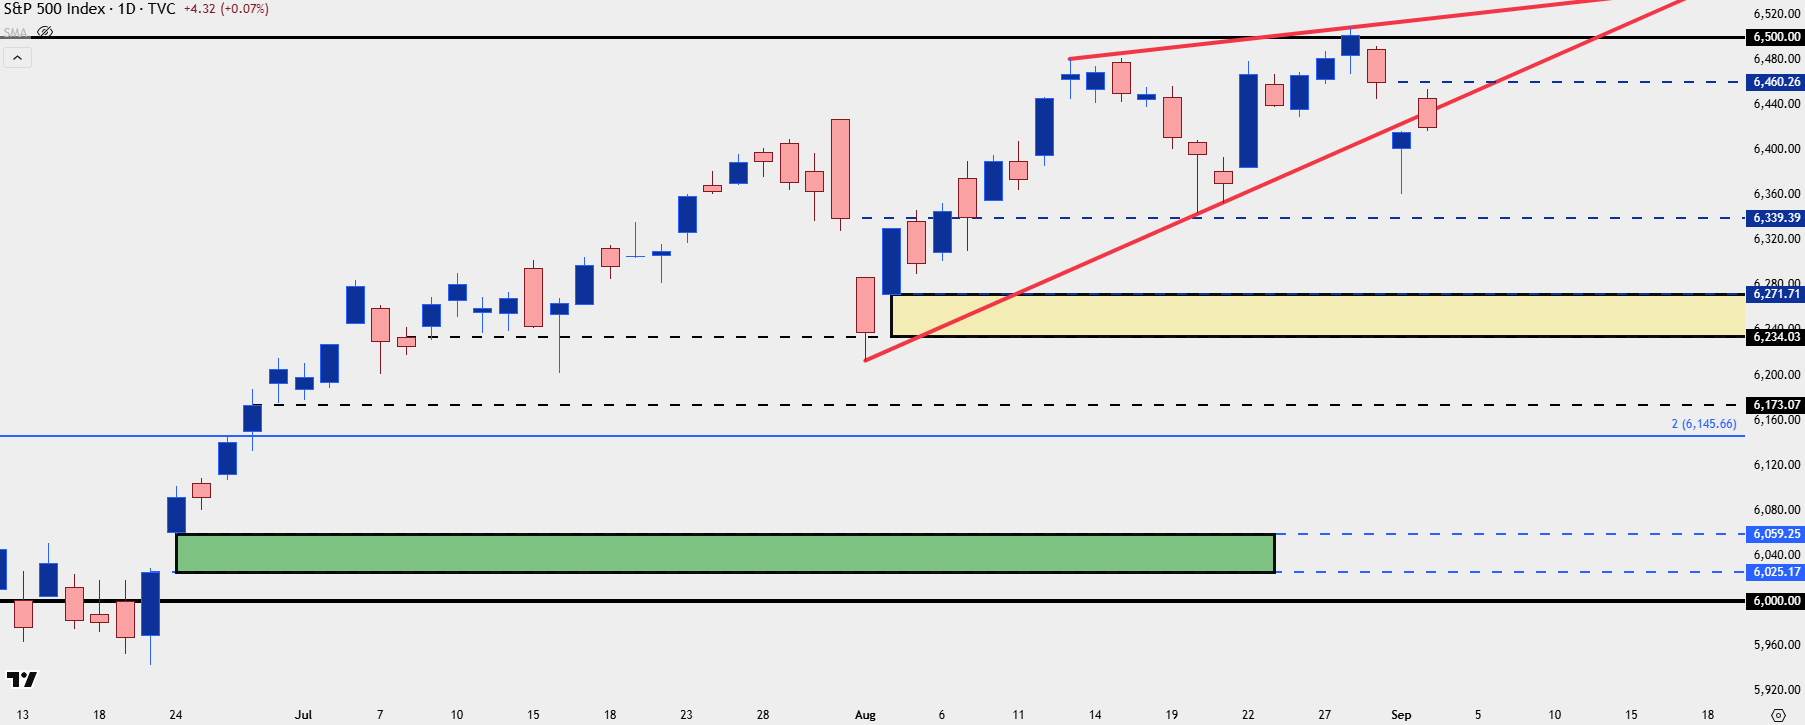
Chart prepared by James Stanley; data derived from Tradingview
--- written by James Stanley, Senior Strategist
Related tags:
Latest market news




The complete CFD trading experience
Award-winning platforms, competitive spreads, low commissions and dedicated support.
We live and breathe the markets and are dedicated to helping traders realise their ambitions as we continue to set the industry bar.
Economic calendar
Web Trader platform
Our sophisticated web-based platform is packed with features.
Related articles

Gold Rallies Towards a $4k Test – but Can Bulls Break the Trend?
Gold prices melted down last week but so far this week, a different tone has taken over. But can this turn into anything more than a short squeeze?



EUR/USD Clings to Support as Lagarde Announces Early Departure
EUR/USD has been mired in a steep sell-off as worries have built around French yields, but continued support around the 1.1100 level give hope for a bounce that could possibly turn into something more.
StoneX Europe Ltd may make third party material available on this website which may contain information included but not limited to the conditions of financial markets. The material is for information purposes only and does not contain, and should not be construed as containing, investment advice and/or investment recommendation and/or an investment research and/or an offer of or solicitation for any transactions in financial instruments; any decision to enter into a specific transaction shall be made by the client following an assessment by him/her of their situation.
StoneX Europe Ltd makes no representation or warranty and assumes no liability as to the accuracy or completeness of the information provided, nor any loss arising from any investment based on a recommendation, forecast or other information supplied. You should always seek independent advice as to your suitability to speculate in any related markets and your ability to assume the associated risks, if you are at all unsure. We are not under any obligation to update any such material. Any opinion made may be personal to the author and may not reflect the opinion of StoneX Europe Ltd.