
Last week I looked at USD/CAD bears taking over, warning that they may be on the verge of a major move. That has since priced-in with the pair now showing oversold readings on the daily chart.

The year is ending on a sour note for USD/CAD bulls and this comes after the bulk of H2 2025 saw the pair trading in a somewhat bullish state. The familiar 1.3750 level is back in the mix and this is a major level, as it was a spot of support-turned-resistance that was the line-in-the-sand for the ascending triangle breakout back in July.
Even as the USD was setting a fresh low on day one of Q3 and another on the Fed’s rate cut announcement on September 17th, USD/CAD was showing bullish items and that 1.3750 spot was a major aspect of that. The price had initially set support back in May and led to a bounce up to the 1.4000 handle, which sellers responded to. But they couldn’t make it much further below 1.3750 and eventually stalled-out in mid-June trade, with higher-lows then building as 1.3750 showed as resistance.
This formed an ascending triangle formation and that bullish breakout setup was at odds with the larger bearish backdrop in the USD. Bulls went for the breakout around the July FOMC meeting – and even though the Dollar reversed on August 1st following the release of Non-farm Payrolls with USD hurdling back towards lows, USD/CAD held a higher-low at that same spot of 1.3750.
USD/CAD Weekly Chart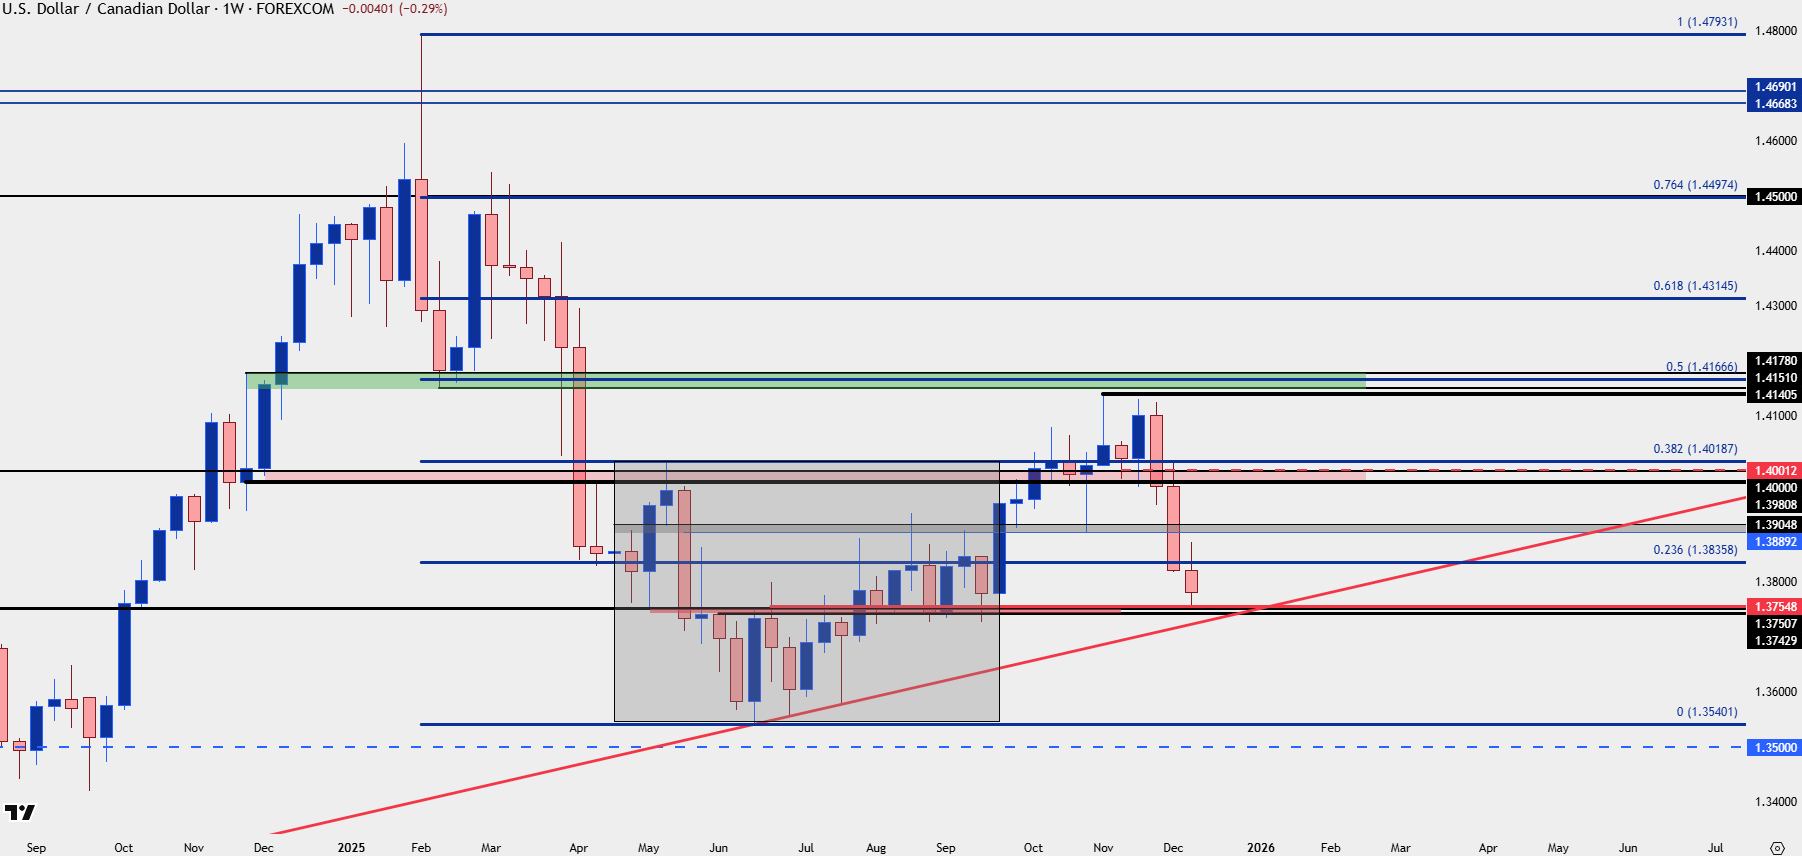
Chart prepared by James Stanley; data derived from Tradingview
USD/CAD Going Oversold on Daily
The challenge with USD/CAD at this point is just how quickly the bearish move has priced-in, and the daily chart is now showing in oversold territory for the firet time since June, which is right around the time that the pair set its current 2025 low. That led to the slow build of higher-lows until, eventually, buyers could force the breakout from the ascending triangle formation.
This doesn’t necessarily spell for reversal, however, but it does highlight the danger of chasing a prolonged move nearing a big support level. And, instead, this can point to resistance potential for lower-highs at an area like 1.3836 or the 1.3900 area that held a significant low around the BoC and FOMC rate decisions in late-October.
USD/CAD Daily Chart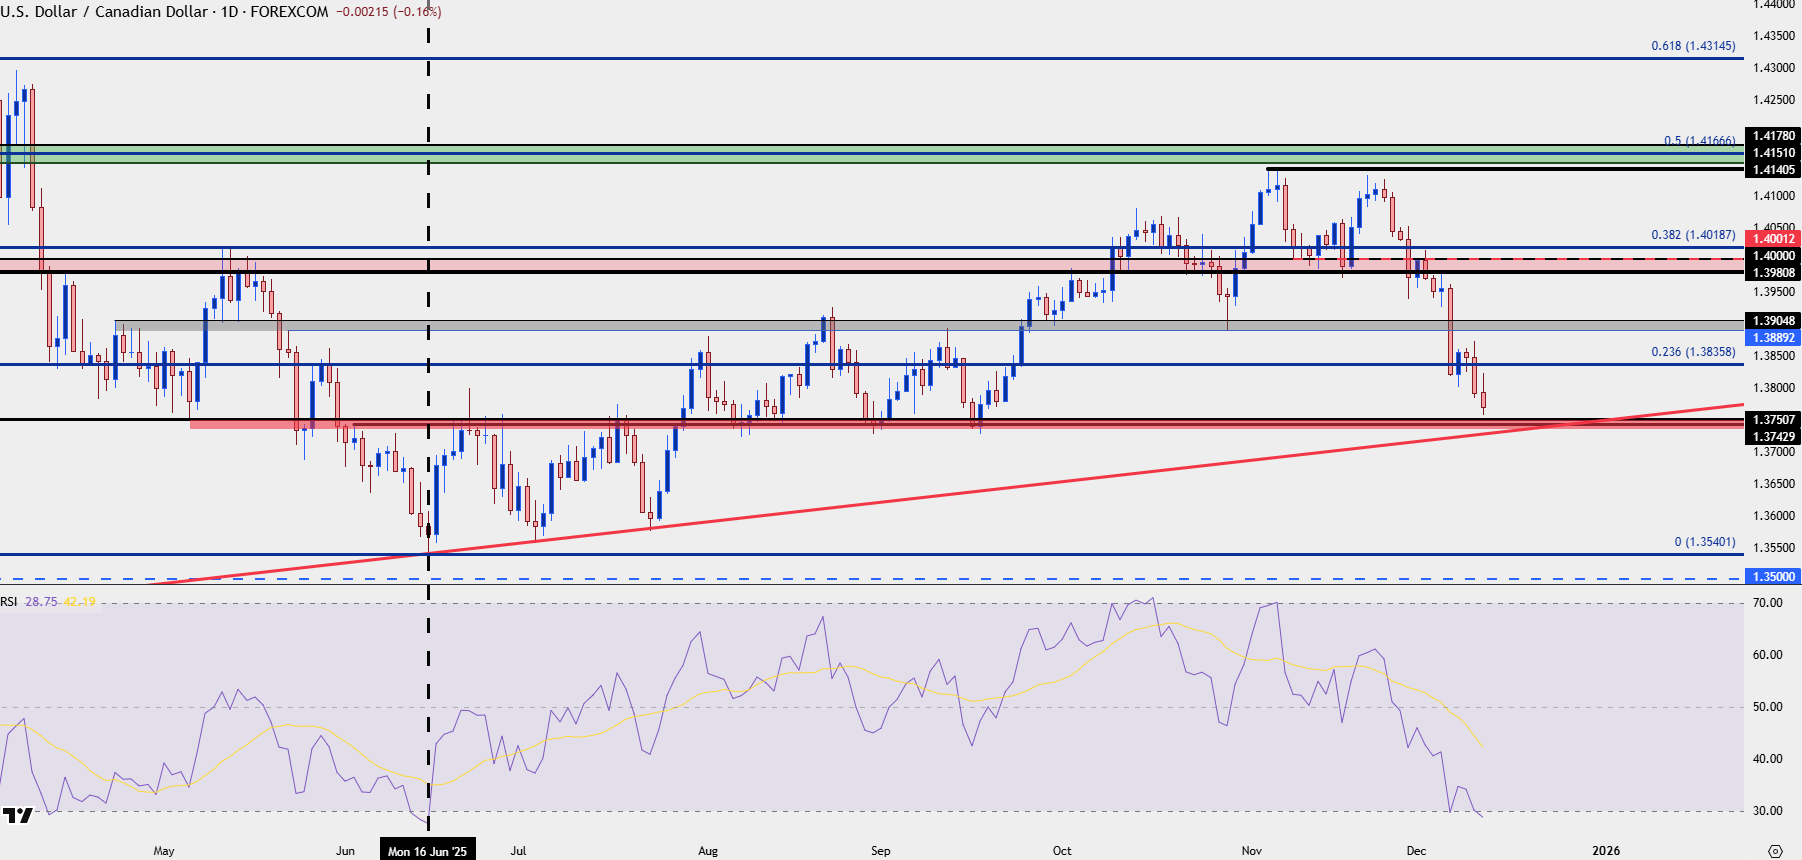
Chart prepared by James Stanley; data derived from Tradingview
USD/CAD Shorter-Term Strategy
From the four-hour chart we can see the continuation of lower-lows and lower-highs after bears re-claimed the 1.4000 level, and this structure also provides some clarity for continuation scenarios. There was a a prior lower-high at 1.3860 which can be spanned to the 1.3836 Fibonacci level to create a zone. Ideally, bears would hold highs inside of that area to force continuation patterns, but if they don’t, the door opens for 1.3900 and then the prior swing-low at 1.3938.
USD/CAD Four-Hour Chart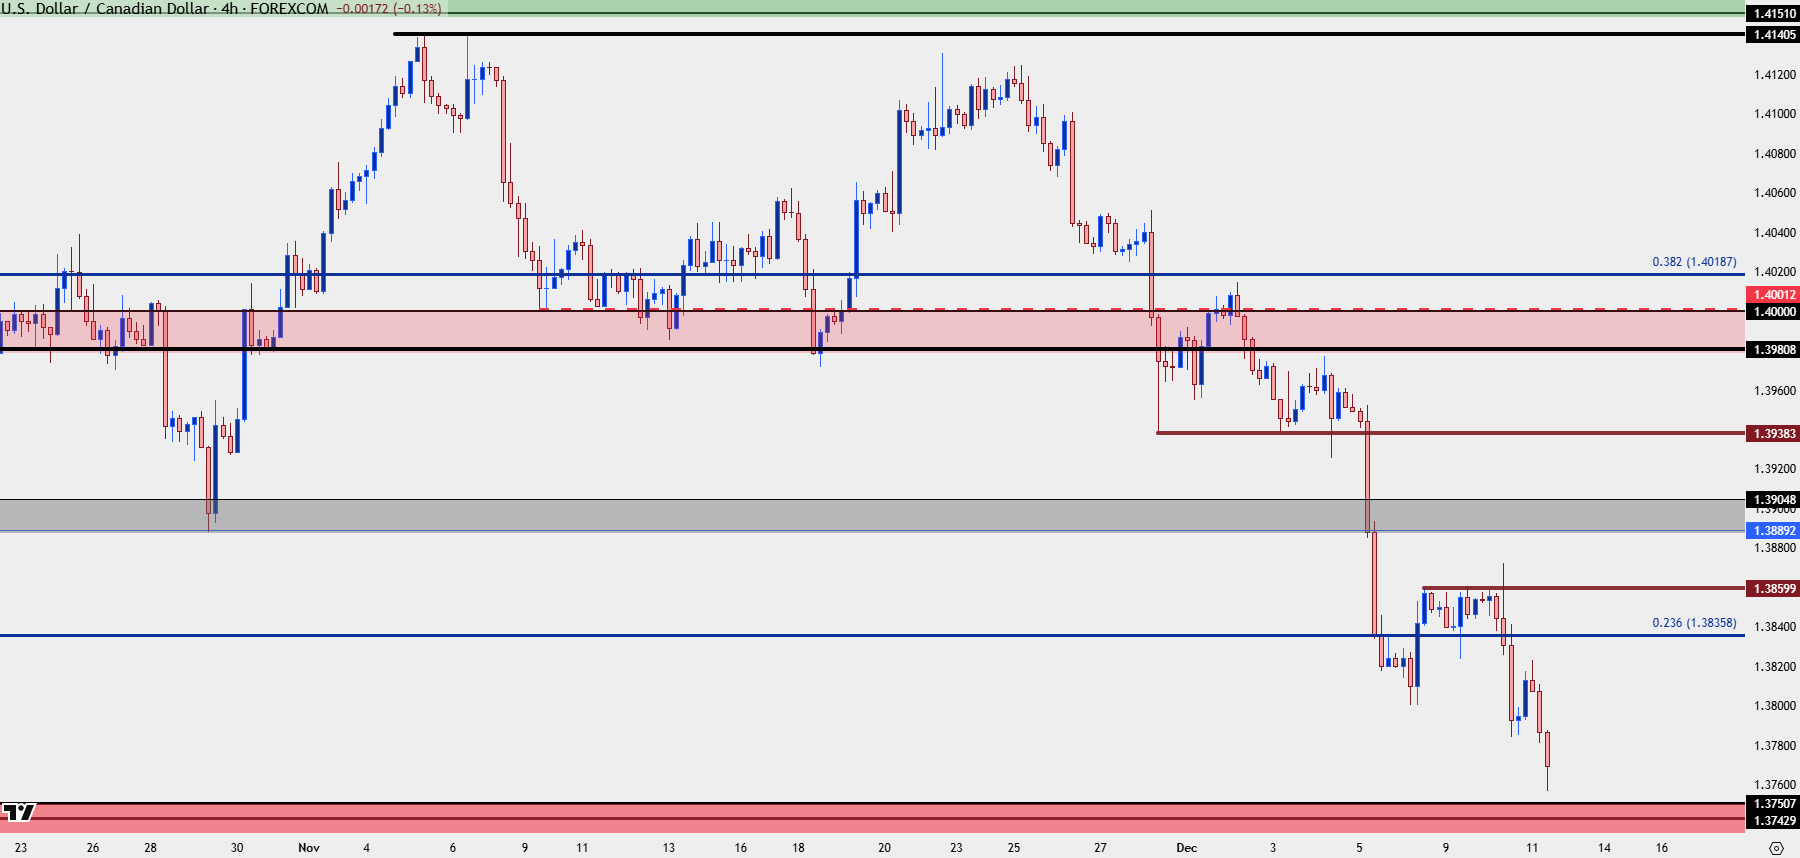
Chart prepared by James Stanley; data derived from Tradingview
--- written by James Stanley, Senior Market Analyst, Global Macro