
EUR/USD, Euro Talking Points:
- EUR/USD rallied in the first-half of the year but started Q3 with an aggressive pullback in July. August and September led to recovery but at this point with a little under two days until quarter-end, it’s been a red quarter for the pair.
- Last year’s Q3 saw strength in EUR/USD as markets warmed up for FOMC rate cuts but even as the Fed cut rates in Q4, EUR/USD sold off hard, plummeting towards a parity handle that never ended up printing in early-2025 trade.
- I’ll be looking into EUR/USD in the weekly webinar, and you’re welcome to join the next. Click here to register.
EUR/USD set a fresh four-year high right as the Fed announced their September rate cut – and then started to sell-off. It’s been a bearish sequence on the daily and four-hour chart since then and this highlights the fact that FOMC rate cuts aren’t necessarily a direct push into a weaker USD and, in turn, a stronger EUR/USD.
Nonetheless, it is too early to count EUR/USD bulls out just yet and as I said in the video, I think ECB stance and Euro data will be a big determinant as to whether both trends can take-over in Q4.
From the monthly chart, it’s been a red quarter for EUR/USD so far following a strong first-half of the year. The pair has tried to leave behind a big spot on the chart around the 1.1748 level but bulls haven’t completely given up yet. This is the expanse between the 76.4 and 78.6% Fibonacci retracements of the 2021-2022 major move. This is a big analytical item as I had highlighted this back in February in the Fibonacci article. This series saw the 61.8% retracement catch the high in 2023, the 38.2 and 50% retracements define the range that traded for a good portion of 2024, and more recently, the 23.6% retracement is what ultimately helped to catch the low earlier this year, before the reversal took over in March.
Now, it’s the 76.4 and 78.6 expanse that has been holding bulls at bay.
EUR/USD Monthly Chart
Chart prepared by James Stanley; data derived from Tradingview

EUR/USD Weekly
The weekly chart highlights just how choppy this quarter has been. It started off with a notable pullback in July, alongside a USD that put in its strongest month in more than three years. This was driven by both strong inflation and the July FOMC meeting, when Powell said that policy didn’t seem overly restrictive given that rising inflation and a labor market that remained near full employment.
But then less than two days later the NFP report sent shockwaves across markets when the prior two months saw massive revisions on the headline number, even with the unemployment rate coming in right at the expected 4.2%, which Powell had said less than two days earlier was ‘near full employment.’
That elicited a strong pullback in USD and bounce in EUR/USD as the pair jumped from the 1.1400 level, and while bulls did continue to push after that, they continued to show passiveness near resistance or highs, even though they did jump in to support pullbacks at higher lows.
That ran all the way until the Fed’s rate cut two weeks ago which produced a wide upper wick, and that’s what led in to a bearish sequence on the daily chart.
EUR/USD Weekly Chart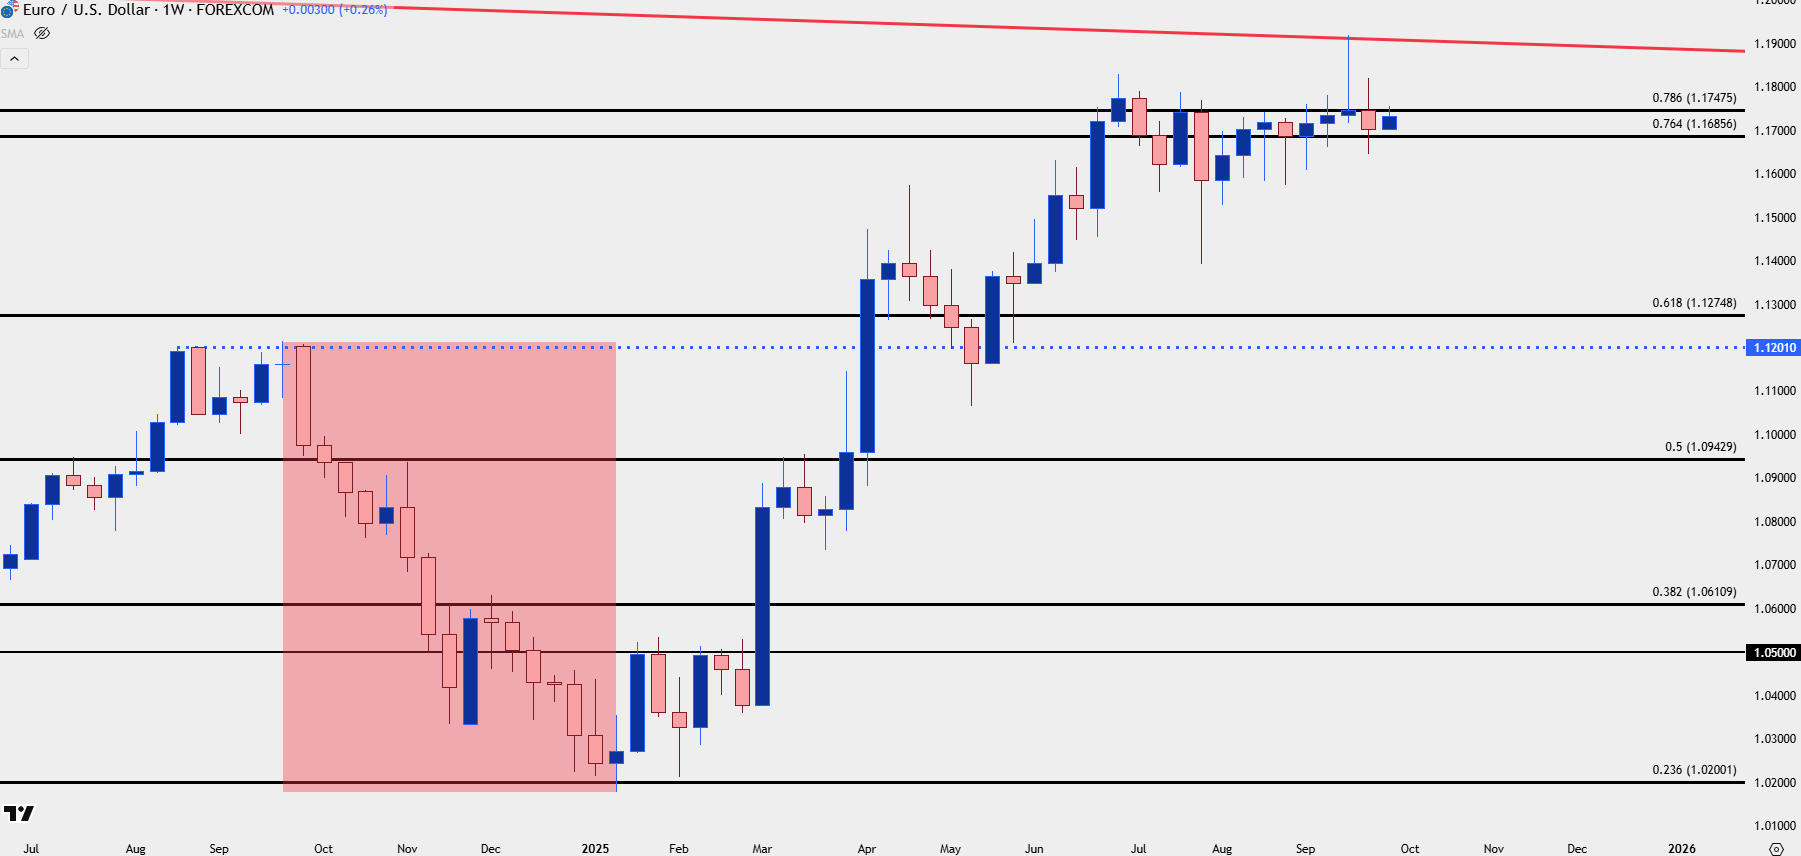
Chart prepared by James Stanley; data derived from Tradingview
EUR/USD Daily
The daily chart is where the bearish sequence has shown so far following the reversal bar that printed at the FOMC meeting two weeks ago. There’s still considerable interplay with the Fibonacci retracement looked at in the first image, as the initial pullback pushed down to 1.1748, which led to a bounce in early trade last week. But sellers came back on Wednesday and Thursday to force a fresh lower-low, and the bounce from that has since held a lower-high right at the same 1.1748 level.
As shown in the video, it’s the prior lower-high from last week, at 1.1820 which spans up to 1.1830, that bulls need to take-out to wrestle back control. A hold at 1.1748 would be ideal for sellers as that would illustrate bearish anticipation and a hold of resistance at prior support, right at a big Fibonacci level. That would also open the door for re-test of 1.1675-1.1686, and if we get a closed body break on the daily chart, that would illustrate sellers ramping matters up a notch, opening the door for tests of 1.1613 and 1.1573 below that.
EUR/USD Daily Chart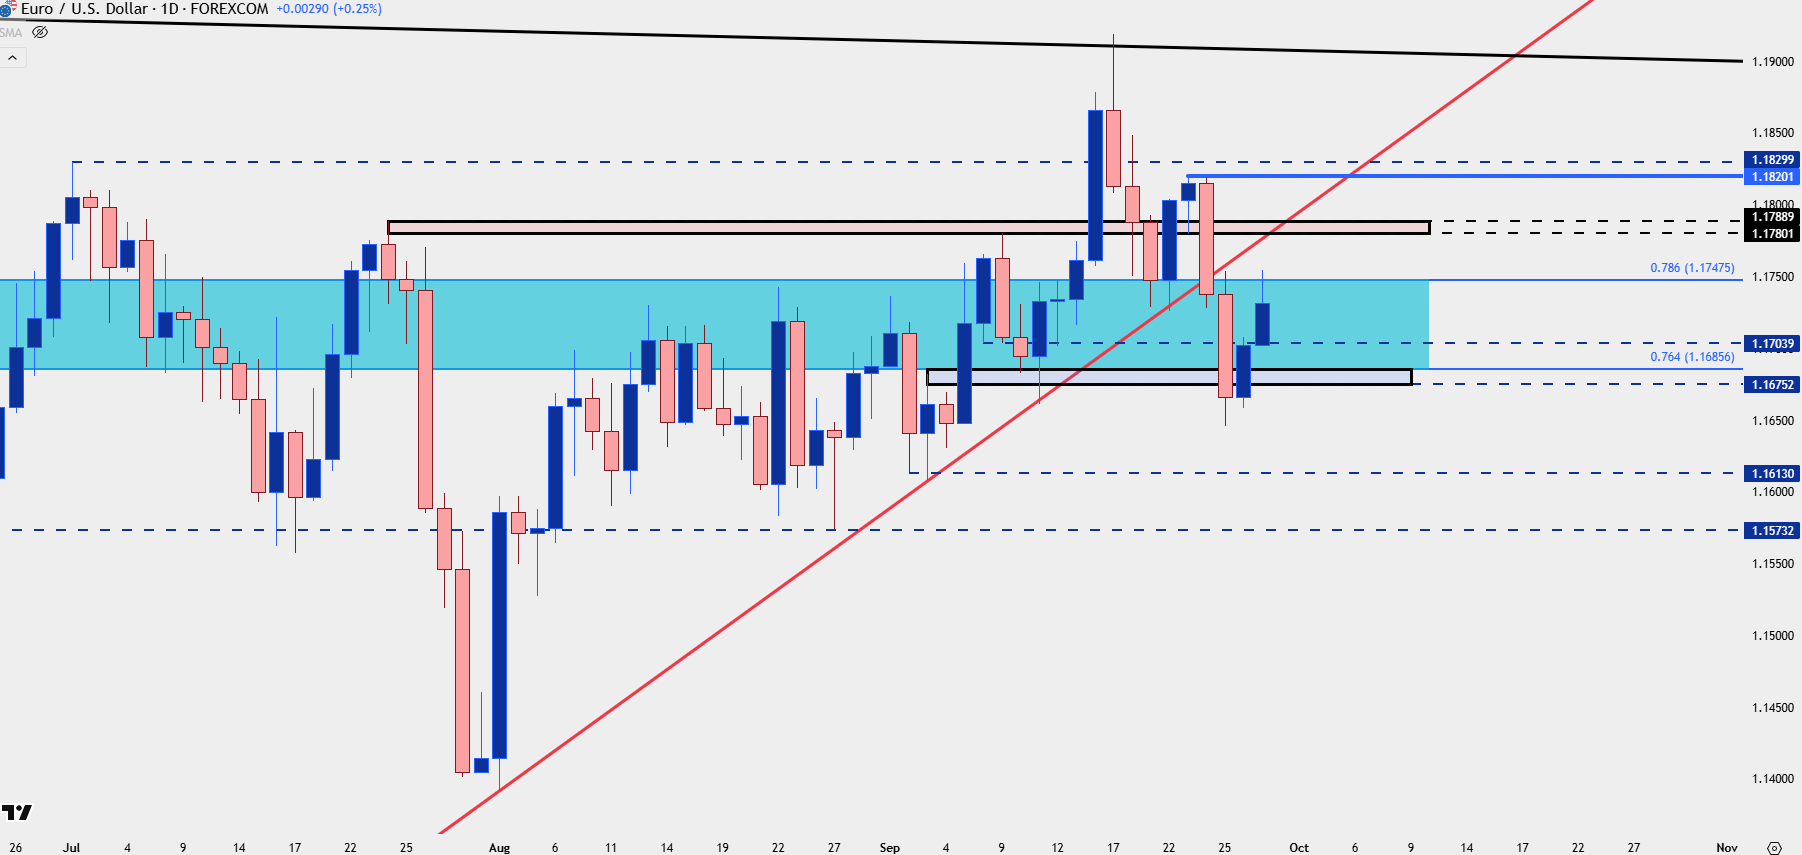
Chart prepared by James Stanley; data derived from Tradingview
--- written by James Stanley, Senior Strategist