
USD, US Dollar Talking Points:
- The US Dollar set a fresh three-year-low at the Fed’s rate cut announcement last week, and then near immediately went into a rally that hasn’t yet stopped.
- This resembles last year’s move and so does the move in Treasuries, as last year’s first rate cut in September led to a gain of 22 bps in the week and a half after. For this year’s episode, 10-year yields are up 20.7 basis points.
- Tomorrow brings an important piece of the puzzle with Core PCE, the Fed’s preferred inflation gauge. The Fed forecast this at 3.1% for this year and the expectation for tomorrow is a 2.9% YoY print.
So far it’s been a ‘sell the rumor, buy the news’ event for the USD following last week’s rate cut announcement from the Fed. While the FOMC forecast another 50 bps in cuts for this year and 25 for next year, markets were hoping for another 50-75 for next year and the response in the USD since then has been clear. The Dollar did set a fresh three-year low just after the announcement, but like last year, sellers were soon stifled and in last year’s episode, that led to a strong rip in DXY in Q4. That rip in the Dollar went along with a jump in Treasury yields, even as the Fed was cutting, because the Fed cutting into a backdrop of high inflation boosts future inflation expectations, further eroding bond yields and making the prospect of holding long-term Treasuries even less attractive.
On a shorter-term basis, the bullish trend in the Dollar has been clear, and the higher-low support that I looked at on Tuesday has been a launching pad for USD bulls up to a fresh near-term high.
USD Four-Hour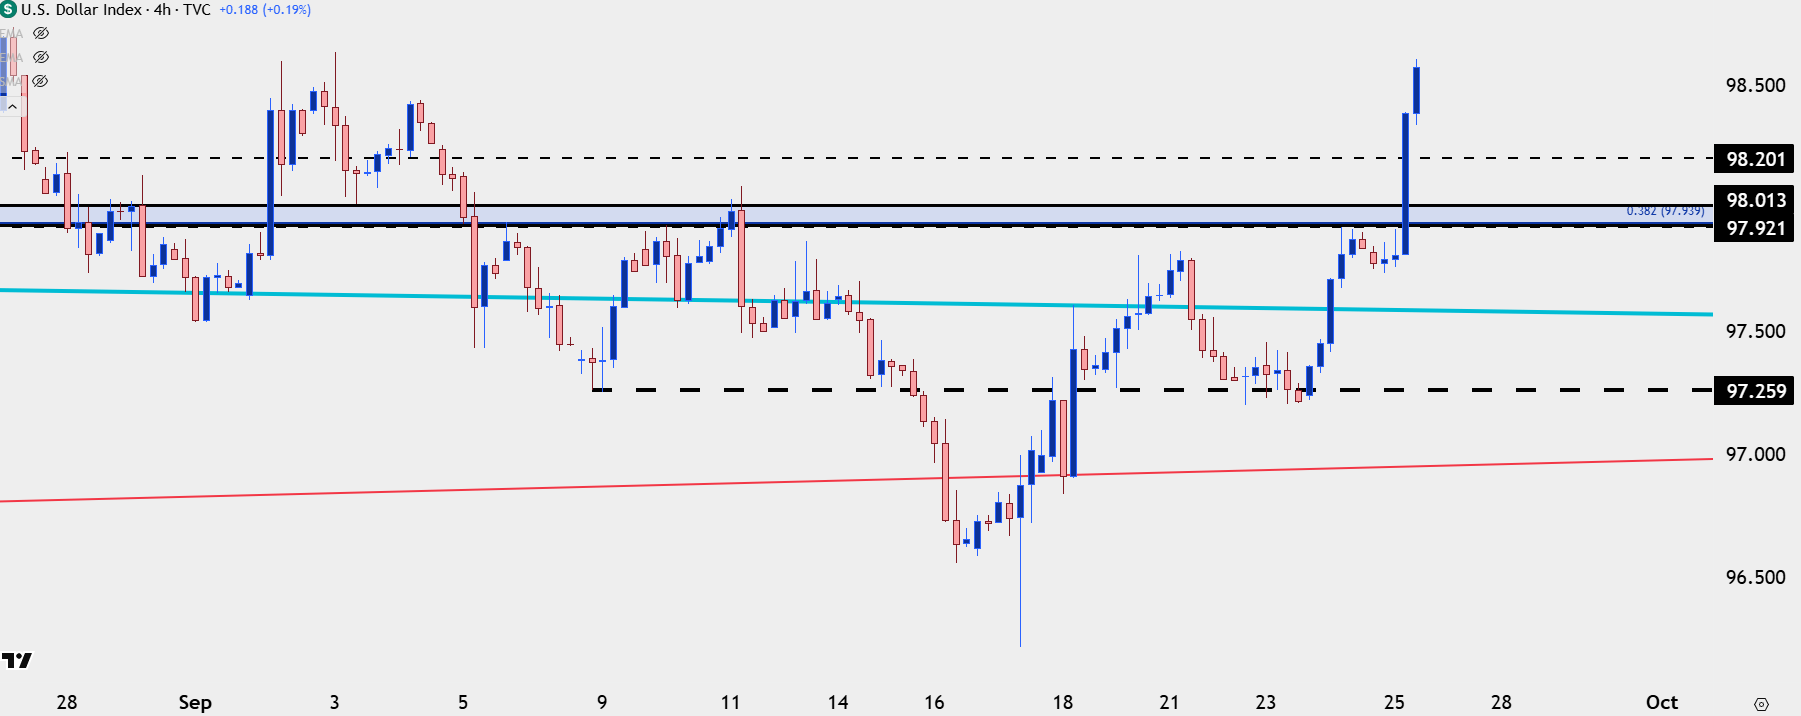
Chart prepared by James Stanley; data derived from Tradingview
USD Dynamics
While the first-half of the year saw a decisive move from USD bears, the 3rd quarter has been considerably choppier, and despite the open door for bears to drive at last week’s rate cut announcement, there’s remained a similar passiveness from sellers with price at lows or near support, even though they have remained fairly aggressive at highs or tests of resistance.
This is what builds falling wedge formations, and that was again similar to last year’s setup in Q3 around the Fed’s first rate cut announcement of the year. Falling wedges are often approached with aim of bullish reversal, and if buyers can take out resistance at the upper trendline, which is currently confluent with the 98 level in DXY, the door opens wider for a larger rally into Q4 trade.
US Dollar Daily Price Chart
Chart prepared by James Stanley; data derived from Tradingview
USD Bigger Picture
The weekly chart is informative here as it illustrates the recent stall from sellers quite well. It also highlights bears continuing to press on rallies until they ultimately had that open door to run a breakdown last week – and then failed to hold the move.
This also highlights the importance of the 99 level in DXY, which has a Fibonacci level at 98.98 to go along with the upper trendline on the falling wedge.
USD Weekly Price Chart
Chart prepared by James Stanley; data derived from Tradingview
--- written by James Stanley, Senior Strategist